

18
2 Actual Potentials of Theoretical Chemistry: What Can Be Obtained
HOMO-2 -12.225 eV
HOMO -7.295 eV
HOMO-1 -10.860 eV
HOMO-3 -13.457 eV
HOMO-4 -17.328 eV
HOMO-5 -28.864 eV
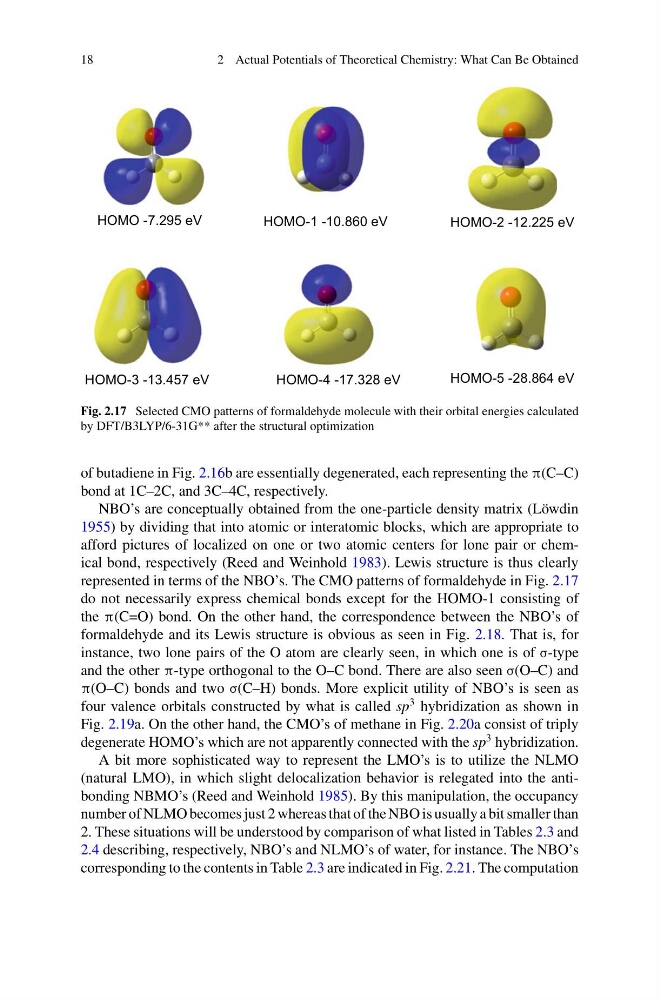
Fig. 2.17 Selected CMO patterns of formaldehyde molecule with their orbital energies calculated
by DFT/B3LYP/6-31G** after the structural optimization
of butadiene in Fig. 2.16b are essentially degenerated, each representing the π(C–C)
bond at 1C–2C, and 3C–4C, respectively.
NBO’s are conceptually obtained from the one-particle density matrix (Löwdin
1955) by dividing that into atomic or interatomic blocks, which are appropriate to
afford pictures of localized on one or two atomic centers for lone pair or chemical bond, respectively (Reed and Weinhold 1983). Lewis structure is thus clearly
represented in terms of the NBO’s. The CMO patterns of formaldehyde in Fig. 2.17
do not necessarily express chemical bonds except for the HOMO-1 consisting of
the π(C=O) bond. On the other hand, the correspondence between the NBO’s of
formaldehyde and its Lewis structure is obvious as seen in Fig. 2.18. That is, for
instance, two lone pairs of the O atom are clearly seen, in which one is of σ-type
and the other π-type orthogonal to the O–C bond. There are also seen σ(O–C) and
π(O–C) bonds and two σ(C–H) bonds. More explicit utility of NBO’s is seen as
four valence orbitals constructed by what is called sp
3 hybridization as shown in
Fig. 2.19a. On the other hand, the CMO’s of methane in Fig. 2.20a consist of triply
degenerate HOMO’s which are not apparently connected with the sp
3 hybridization.
A bit more sophisticated way to represent the LMO’s is to utilize the NLMO
(natural LMO), in which slight delocalization behavior is relegated into the antibonding NBMO’s (Reed and Weinhold 1985). By this manipulation, the occupancy
number of NLMO becomes just 2 whereas that of the NBO is usually a bit smaller than
2. These situations will be understood by comparison of what listed in Tables 2.3 and
2.4 describing, respectively, NBO’s and NLMO’s of water, for instance. The NBO’s
corresponding to the contents in Table 2.3 are indicated in Fig. 2.21. The computation
2 Actual Potentials of Theoretical Chemistry: What Can Be Obtained
HOMO-2 -12.225 eV
HOMO -7.295 eV
HOMO-1 -10.860 eV
HOMO-3 -13.457 eV
HOMO-4 -17.328 eV
HOMO-5 -28.864 eV
Fig. 2.17 Selected CMO patterns of formaldehyde molecule with their orbital energies calculated
by DFT/B3LYP/6-31G** after the structural optimization
of butadiene in Fig. 2.16b are essentially degenerated, each representing the π(C–C)
bond at 1C–2C, and 3C–4C, respectively.
NBO’s are conceptually obtained from the one-particle density matrix (Löwdin
1955) by dividing that into atomic or interatomic blocks, which are appropriate to
afford pictures of localized on one or two atomic centers for lone pair or chemical bond, respectively (Reed and Weinhold 1983). Lewis structure is thus clearly
represented in terms of the NBO’s. The CMO patterns of formaldehyde in Fig. 2.17
do not necessarily express chemical bonds except for the HOMO-1 consisting of
the π(C=O) bond. On the other hand, the correspondence between the NBO’s of
formaldehyde and its Lewis structure is obvious as seen in Fig. 2.18. That is, for
instance, two lone pairs of the O atom are clearly seen, in which one is of σ-type
and the other π-type orthogonal to the O–C bond. There are also seen σ(O–C) and
π(O–C) bonds and two σ(C–H) bonds. More explicit utility of NBO’s is seen as
four valence orbitals constructed by what is called sp
3 hybridization as shown in
Fig. 2.19a. On the other hand, the CMO’s of methane in Fig. 2.20a consist of triply
degenerate HOMO’s which are not apparently connected with the sp
3 hybridization.
A bit more sophisticated way to represent the LMO’s is to utilize the NLMO
(natural LMO), in which slight delocalization behavior is relegated into the antibonding NBMO’s (Reed and Weinhold 1985). By this manipulation, the occupancy
number of NLMO becomes just 2 whereas that of the NBO is usually a bit smaller than
2. These situations will be understood by comparison of what listed in Tables 2.3 and
2.4 describing, respectively, NBO’s and NLMO’s of water, for instance. The NBO’s
corresponding to the contents in Table 2.3 are indicated in Fig. 2.21. The computation