

4.1 Nanoscience
161
CNT
H-CNT
0
0.5
1
1.5
2
0
50
100
150
200
250
300
350
0
0 . 5
1
1 . 5
2
0
0.2
0.4
0.6
0.8
1
1.2
1.4
H-CNT
I
sd (μA)
I
sd (μA)
V sd (V)
V sd (V)
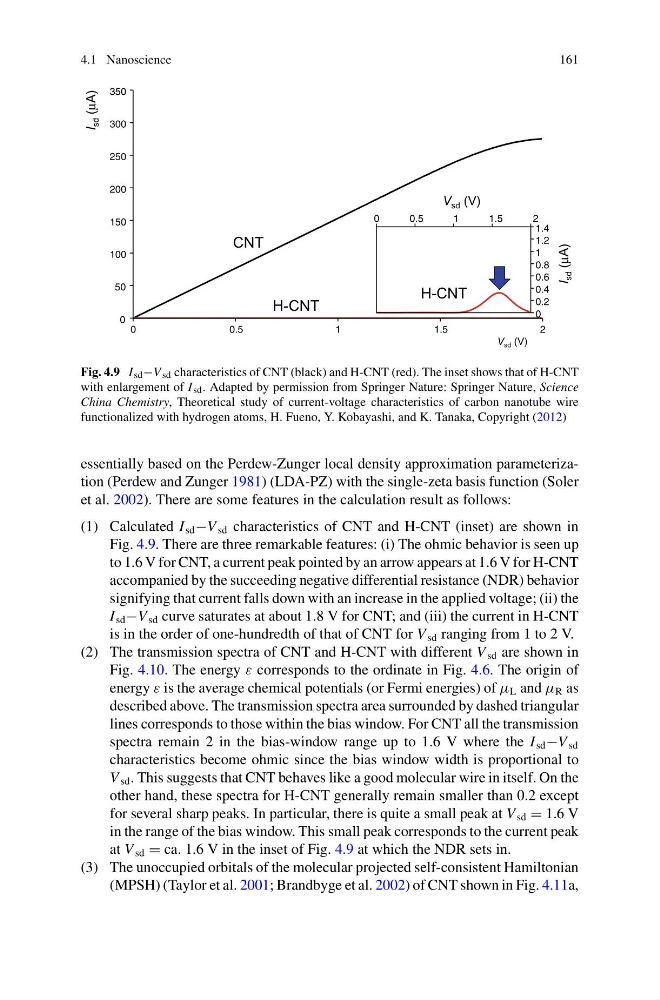
Fig. 4.9 I sd −V sd characteristics of CNT (black) and H-CNT (red). The inset shows that of H-CNT
with enlargement of I sd . Adapted by permission from Springer Nature: Springer Nature, Science
China Chemistry, Theoretical study of current-voltage characteristics of carbon nanotube wire
functionalized with hydrogen atoms, H. Fueno, Y. Kobayashi, and K. Tanaka, Copyright (2012)
essentially based on the Perdew-Zunger local density approximation parameterization (Perdew and Zunger 1981) (LDA-PZ) with the single-zeta basis function (Soler
et al. 2002). There are some features in the calculation result as follows:
(1) Calculated I sd −V sd characteristics of CNT and H-CNT (inset) are shown in
Fig. 4.9. There are three remarkable features: (i) The ohmic behavior is seen up
to 1.6 V for CNT, a current peak pointed by an arrow appears at 1.6 V for H-CNT
accompanied by the succeeding negative differential resistance (NDR) behavior
signifying that current falls down with an increase in the applied voltage; (ii) the
I sd −V sd curve saturates at about 1.8 V for CNT; and (iii) the current in H-CNT
is in the order of one-hundredth of that of CNT for V sd ranging from 1 to 2 V.
(2) The transmission spectra of CNT and H-CNT with different V sd are shown in
Fig. 4.10. The energy ε corresponds to the ordinate in Fig. 4.6. The origin of
energy ε is the average chemical potentials (or Fermi energies) of μ L and μ R as
described above. The transmission spectra area surrounded by dashed triangular
lines corresponds to those within the bias window. For CNT all the transmission
spectra remain 2 in the bias-window range up to 1.6 V where the I sd −V sd
characteristics become ohmic since the bias window width is proportional to
V sd . This suggests that CNT behaves like a good molecular wire in itself. On the
other hand, these spectra for H-CNT generally remain smaller than 0.2 except
for several sharp peaks. In particular, there is quite a small peak at V sd = 1.6 V
in the range of the bias window. This small peak corresponds to the current peak
at V sd = ca. 1.6 V in the inset of Fig. 4.9 at which the NDR sets in.
(3) The unoccupied orbitals of the molecular projected self-consistent Hamiltonian
(MPSH) (Taylor et al. 2001; Brandbyge et al. 2002) of CNT shown in Fig. 4.11a,
161
CNT
H-CNT
0
0.5
1
1.5
2
0
50
100
150
200
250
300
350
0
0 . 5
1
1 . 5
2
0
0.2
0.4
0.6
0.8
1
1.2
1.4
H-CNT
I
sd (μA)
I
sd (μA)
V sd (V)
V sd (V)
Fig. 4.9 I sd −V sd characteristics of CNT (black) and H-CNT (red). The inset shows that of H-CNT
with enlargement of I sd . Adapted by permission from Springer Nature: Springer Nature, Science
China Chemistry, Theoretical study of current-voltage characteristics of carbon nanotube wire
functionalized with hydrogen atoms, H. Fueno, Y. Kobayashi, and K. Tanaka, Copyright (2012)
essentially based on the Perdew-Zunger local density approximation parameterization (Perdew and Zunger 1981) (LDA-PZ) with the single-zeta basis function (Soler
et al. 2002). There are some features in the calculation result as follows:
(1) Calculated I sd −V sd characteristics of CNT and H-CNT (inset) are shown in
Fig. 4.9. There are three remarkable features: (i) The ohmic behavior is seen up
to 1.6 V for CNT, a current peak pointed by an arrow appears at 1.6 V for H-CNT
accompanied by the succeeding negative differential resistance (NDR) behavior
signifying that current falls down with an increase in the applied voltage; (ii) the
I sd −V sd curve saturates at about 1.8 V for CNT; and (iii) the current in H-CNT
is in the order of one-hundredth of that of CNT for V sd ranging from 1 to 2 V.
(2) The transmission spectra of CNT and H-CNT with different V sd are shown in
Fig. 4.10. The energy ε corresponds to the ordinate in Fig. 4.6. The origin of
energy ε is the average chemical potentials (or Fermi energies) of μ L and μ R as
described above. The transmission spectra area surrounded by dashed triangular
lines corresponds to those within the bias window. For CNT all the transmission
spectra remain 2 in the bias-window range up to 1.6 V where the I sd −V sd
characteristics become ohmic since the bias window width is proportional to
V sd . This suggests that CNT behaves like a good molecular wire in itself. On the
other hand, these spectra for H-CNT generally remain smaller than 0.2 except
for several sharp peaks. In particular, there is quite a small peak at V sd = 1.6 V
in the range of the bias window. This small peak corresponds to the current peak
at V sd = ca. 1.6 V in the inset of Fig. 4.9 at which the NDR sets in.
(3) The unoccupied orbitals of the molecular projected self-consistent Hamiltonian
(MPSH) (Taylor et al. 2001; Brandbyge et al. 2002) of CNT shown in Fig. 4.11a,