

4.1 Nanoscience
157
S
S
S
S
H2
C
CH2
S1
S2
H
H
2.624
2.639
2.882
2.884
S
S
S
S
CH2 CH2
S1
S2
H
H
2.577
2.599
2.771
4.389
(a)
(b)
(c)
S
S
S
S
H2C
CH2
S
SH
H
H
2.727
2.636
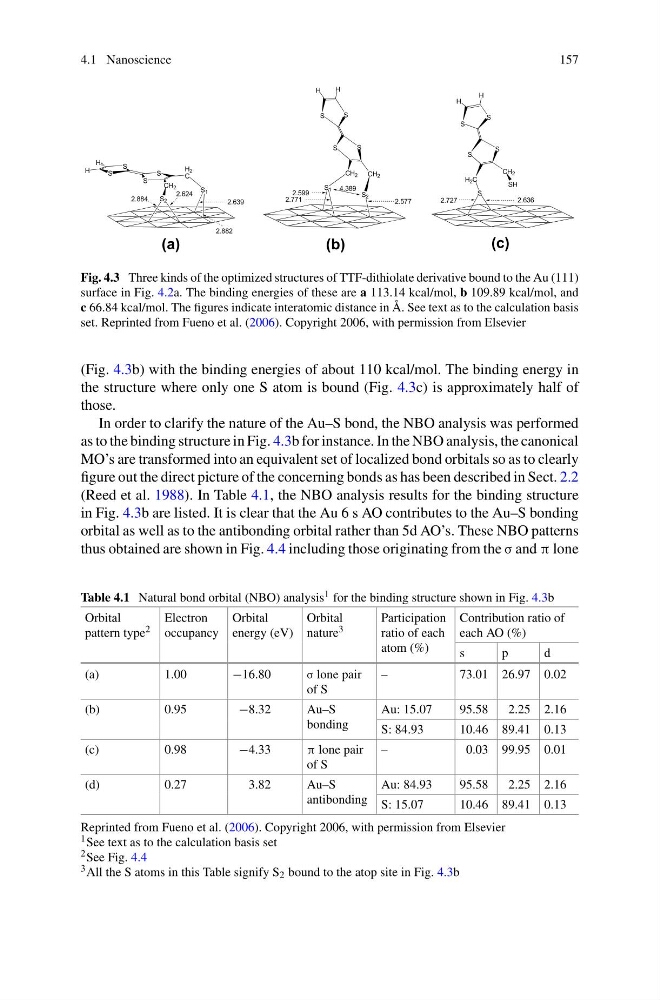
Fig. 4.3 Three kinds of the optimized structures of TTF-dithiolate derivative bound to the Au (111)
surface in Fig. 4.2a. The binding energies of these are a 113.14 kcal/mol, b 109.89 kcal/mol, and
c 66.84 kcal/mol. The figures indicate interatomic distance in Å. See text as to the calculation basis
set. Reprinted from Fueno et al. (2006). Copyright 2006, with permission from Elsevier
(Fig. 4.3b) with the binding energies of about 110 kcal/mol. The binding energy in
the structure where only one S atom is bound (Fig. 4.3c) is approximately half of
those.
In order to clarify the nature of the Au–S bond, the NBO analysis was performed
as to the binding structure in Fig. 4.3b for instance. In the NBO analysis, the canonical
MO’s are transformed into an equivalent set of localized bond orbitals so as to clearly
figure out the direct picture of the concerning bonds as has been described in Sect. 2.2
(Reed et al. 1988). In Table 4.1, the NBO analysis results for the binding structure
in Fig. 4.3b are listed. It is clear that the Au 6 s AO contributes to the Au–S bonding
orbital as well as to the antibonding orbital rather than 5d AO’s. These NBO patterns
thus obtained are shown in Fig. 4.4 including those originating from the σ and π lone
Table 4.1 Natural bond orbital (NBO) analysis 1 for the binding structure shown in Fig. 4.3b
Orbital
pattern type 2
Electron
occupancy
Orbital
energy (eV)
Orbital
nature 3
Participation
ratio of each
atom (%)
Contribution ratio of
each AO (%)
s
p
d
(a)
1.00
−16.80
σ lone pair
of S
–
73.01 26.97 0.02
(b)
0.95
−8.32
Au–S
bonding
Au: 15.07
95.58
2.25 2.16
S: 84.93
10.46 89.41 0.13
(c)
0.98
−4.33
π lone pair
of S
–
0.03 99.95 0.01
(d)
0.27
3.82
Au–S
antibonding
Au: 84.93
95.58
2.25 2.16
S: 15.07
10.46 89.41 0.13
Reprinted from Fueno et al. (2006). Copyright 2006, with permission from Elsevier
1 See text as to the calculation basis set
2 See Fig. 4.4
3 All the S atoms in this Table signify S 2 bound to the atop site in Fig. 4.3b
157
S
S
S
S
H2
C
CH2
S1
S2
H
H
2.624
2.639
2.882
2.884
S
S
S
S
CH2 CH2
S1
S2
H
H
2.577
2.599
2.771
4.389
(a)
(b)
(c)
S
S
S
S
H2C
CH2
S
SH
H
H
2.727
2.636
Fig. 4.3 Three kinds of the optimized structures of TTF-dithiolate derivative bound to the Au (111)
surface in Fig. 4.2a. The binding energies of these are a 113.14 kcal/mol, b 109.89 kcal/mol, and
c 66.84 kcal/mol. The figures indicate interatomic distance in Å. See text as to the calculation basis
set. Reprinted from Fueno et al. (2006). Copyright 2006, with permission from Elsevier
(Fig. 4.3b) with the binding energies of about 110 kcal/mol. The binding energy in
the structure where only one S atom is bound (Fig. 4.3c) is approximately half of
those.
In order to clarify the nature of the Au–S bond, the NBO analysis was performed
as to the binding structure in Fig. 4.3b for instance. In the NBO analysis, the canonical
MO’s are transformed into an equivalent set of localized bond orbitals so as to clearly
figure out the direct picture of the concerning bonds as has been described in Sect. 2.2
(Reed et al. 1988). In Table 4.1, the NBO analysis results for the binding structure
in Fig. 4.3b are listed. It is clear that the Au 6 s AO contributes to the Au–S bonding
orbital as well as to the antibonding orbital rather than 5d AO’s. These NBO patterns
thus obtained are shown in Fig. 4.4 including those originating from the σ and π lone
Table 4.1 Natural bond orbital (NBO) analysis 1 for the binding structure shown in Fig. 4.3b
Orbital
pattern type 2
Electron
occupancy
Orbital
energy (eV)
Orbital
nature 3
Participation
ratio of each
atom (%)
Contribution ratio of
each AO (%)
s
p
d
(a)
1.00
−16.80
σ lone pair
of S
–
73.01 26.97 0.02
(b)
0.95
−8.32
Au–S
bonding
Au: 15.07
95.58
2.25 2.16
S: 84.93
10.46 89.41 0.13
(c)
0.98
−4.33
π lone pair
of S
–
0.03 99.95 0.01
(d)
0.27
3.82
Au–S
antibonding
Au: 84.93
95.58
2.25 2.16
S: 15.07
10.46 89.41 0.13
Reprinted from Fueno et al. (2006). Copyright 2006, with permission from Elsevier
1 See text as to the calculation basis set
2 See Fig. 4.4
3 All the S atoms in this Table signify S 2 bound to the atop site in Fig. 4.3b