

3.5 ONIOM Method
141
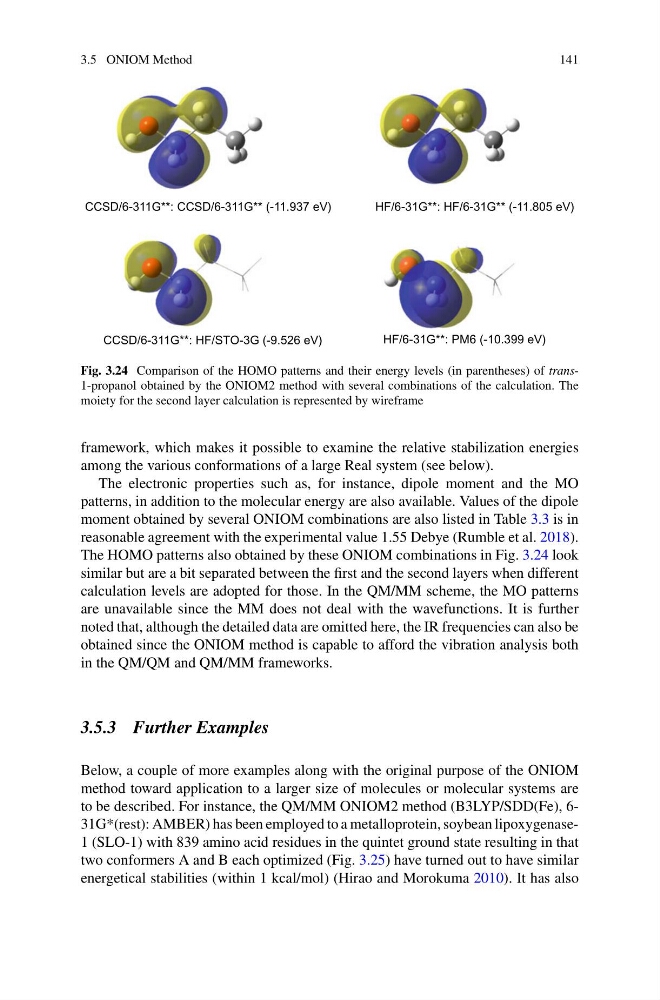
HF/6-31G**: PM6 (-10.399 eV)
HF/6-31G**: HF/6-31G** (-11.805 eV)
CCSD/6-311G**: HF/STO-3G (-9.526 eV)
CCSD/6-311G**: CCSD/6-311G** (-11.937 eV)
Fig. 3.24 Comparison of the HOMO patterns and their energy levels (in parentheses) of trans1-propanol obtained by the ONIOM2 method with several combinations of the calculation. The
moiety for the second layer calculation is represented by wireframe
framework, which makes it possible to examine the relative stabilization energies
among the various conformations of a large Real system (see below).
The electronic properties such as, for instance, dipole moment and the MO
patterns, in addition to the molecular energy are also available. Values of the dipole
moment obtained by several ONIOM combinations are also listed in Table 3.3 is in
reasonable agreement with the experimental value 1.55 Debye (Rumble et al. 2018).
The HOMO patterns also obtained by these ONIOM combinations in Fig. 3.24 look
similar but are a bit separated between the first and the second layers when different
calculation levels are adopted for those. In the QM/MM scheme, the MO patterns
are unavailable since the MM does not deal with the wavefunctions. It is further
noted that, although the detailed data are omitted here, the IR frequencies can also be
obtained since the ONIOM method is capable to afford the vibration analysis both
in the QM/QM and QM/MM frameworks.
3.5.3 Further Examples
Below, a couple of more examples along with the original purpose of the ONIOM
method toward application to a larger size of molecules or molecular systems are
to be described. For instance, the QM/MM ONIOM2 method (B3LYP/SDD(Fe), 631G*(rest): AMBER) has been employed to a metalloprotein, soybean lipoxygenase1 (SLO-1) with 839 amino acid residues in the quintet ground state resulting in that
two conformers A and B each optimized (Fig. 3.25) have turned out to have similar
energetical stabilities (within 1 kcal/mol) (Hirao and Morokuma 2010). It has also
141
HF/6-31G**: PM6 (-10.399 eV)
HF/6-31G**: HF/6-31G** (-11.805 eV)
CCSD/6-311G**: HF/STO-3G (-9.526 eV)
CCSD/6-311G**: CCSD/6-311G** (-11.937 eV)
Fig. 3.24 Comparison of the HOMO patterns and their energy levels (in parentheses) of trans1-propanol obtained by the ONIOM2 method with several combinations of the calculation. The
moiety for the second layer calculation is represented by wireframe
framework, which makes it possible to examine the relative stabilization energies
among the various conformations of a large Real system (see below).
The electronic properties such as, for instance, dipole moment and the MO
patterns, in addition to the molecular energy are also available. Values of the dipole
moment obtained by several ONIOM combinations are also listed in Table 3.3 is in
reasonable agreement with the experimental value 1.55 Debye (Rumble et al. 2018).
The HOMO patterns also obtained by these ONIOM combinations in Fig. 3.24 look
similar but are a bit separated between the first and the second layers when different
calculation levels are adopted for those. In the QM/MM scheme, the MO patterns
are unavailable since the MM does not deal with the wavefunctions. It is further
noted that, although the detailed data are omitted here, the IR frequencies can also be
obtained since the ONIOM method is capable to afford the vibration analysis both
in the QM/QM and QM/MM frameworks.
3.5.3 Further Examples
Below, a couple of more examples along with the original purpose of the ONIOM
method toward application to a larger size of molecules or molecular systems are
to be described. For instance, the QM/MM ONIOM2 method (B3LYP/SDD(Fe), 631G*(rest): AMBER) has been employed to a metalloprotein, soybean lipoxygenase1 (SLO-1) with 839 amino acid residues in the quintet ground state resulting in that
two conformers A and B each optimized (Fig. 3.25) have turned out to have similar
energetical stabilities (within 1 kcal/mol) (Hirao and Morokuma 2010). It has also