

K ¼
R
2
c Á lnðL=R w Þ
2LT 0
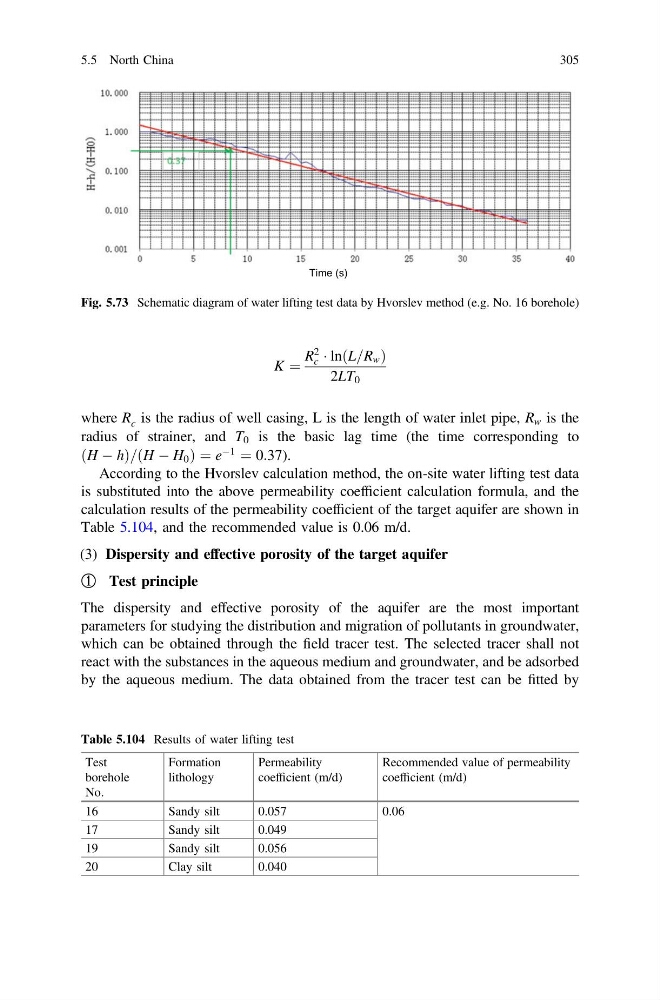
where R c is the radius of well casing, L is the length of water inlet pipe, R w is the
radius of strainer, and T 0 is the basic lag time (the time corresponding to
ðH À hÞ=ðH À H 0 Þ ¼ e
À1
¼ 0:37).
According to the Hvorslev calculation method, the on-site water lifting test data
is substituted into the above permeability coefficient calculation formula, and the
calculation results of the permeability coefficient of the target aquifer are shown in
Table 5.104, and the recommended value is 0.06 m/d.
(3) Dispersity and effective porosity of the target aquifer
① Test principle
The dispersity and effective porosity of the aquifer are the most important
parameters for studying the distribution and migration of pollutants in groundwater,
which can be obtained through the field tracer test. The selected tracer shall not
react with the substances in the aqueous medium and groundwater, and be adsorbed
by the aqueous medium. The data obtained from the tracer test can be fitted by
Time (s)
Fig. 5.73 Schematic diagram of water lifting test data by Hvorslev method (e.g. No. 16 borehole)
Table 5.104 Results of water lifting test
Test
borehole
No.
Formation
lithology
Permeability
coefficient (m/d)
Recommended value of permeability
coefficient (m/d)
16
Sandy silt
0.057
0.06
17
Sandy silt
0.049
19
Sandy silt
0.056
20
Clay silt
0.040
5.5 North China
305
R
2
c Á lnðL=R w Þ
2LT 0
where R c is the radius of well casing, L is the length of water inlet pipe, R w is the
radius of strainer, and T 0 is the basic lag time (the time corresponding to
ðH À hÞ=ðH À H 0 Þ ¼ e
À1
¼ 0:37).
According to the Hvorslev calculation method, the on-site water lifting test data
is substituted into the above permeability coefficient calculation formula, and the
calculation results of the permeability coefficient of the target aquifer are shown in
Table 5.104, and the recommended value is 0.06 m/d.
(3) Dispersity and effective porosity of the target aquifer
① Test principle
The dispersity and effective porosity of the aquifer are the most important
parameters for studying the distribution and migration of pollutants in groundwater,
which can be obtained through the field tracer test. The selected tracer shall not
react with the substances in the aqueous medium and groundwater, and be adsorbed
by the aqueous medium. The data obtained from the tracer test can be fitted by
Time (s)
Fig. 5.73 Schematic diagram of water lifting test data by Hvorslev method (e.g. No. 16 borehole)
Table 5.104 Results of water lifting test
Test
borehole
No.
Formation
lithology
Permeability
coefficient (m/d)
Recommended value of permeability
coefficient (m/d)
16
Sandy silt
0.057
0.06
17
Sandy silt
0.049
19
Sandy silt
0.056
20
Clay silt
0.040
5.5 North China
305