

14.11 m. It is classified as confined water, distributed continuously in the landfill
area and has a depth of about 3.14–3.72 m. The monitoring well information and
specific measurement results of water level are shown in Table 5.84.
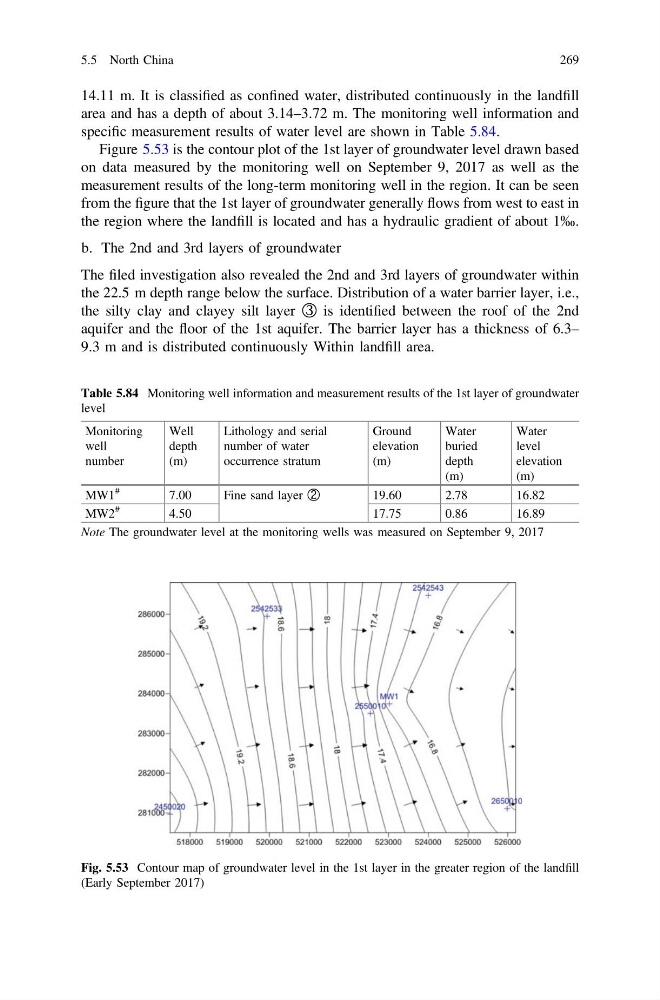
Figure 5.53 is the contour plot of the 1st layer of groundwater level drawn based
on data measured by the monitoring well on September 9, 2017 as well as the
measurement results of the long-term monitoring well in the region. It can be seen
from the figure that the 1st layer of groundwater generally flows from west to east in
the region where the landfill is located and has a hydraulic gradient of about 1‰.
b. The 2nd and 3rd layers of groundwater
The filed investigation also revealed the 2nd and 3rd layers of groundwater within
the 22.5 m depth range below the surface. Distribution of a water barrier layer, i.e.,
the silty clay and clayey silt layer ③ is identified between the roof of the 2nd
aquifer and the floor of the 1st aquifer. The barrier layer has a thickness of 6.3–
9.3 m and is distributed continuously Within landfill area.
Fig. 5.53 Contour map of groundwater level in the 1st layer in the greater region of the landfill
(Early September 2017)
Table 5.84 Monitoring well information and measurement results of the 1st layer of groundwater
level
Monitoring
well
number
Well
depth
(m)
Lithology and serial
number of water
occurrence stratum
Ground
elevation
(m)
Water
buried
depth
(m)
Water
level
elevation
(m)
MW1
#
7.00
Fine sand layer ②
19.60
2.78
16.82
MW2
#
4.50
17.75
0.86
16.89
Note The groundwater level at the monitoring wells was measured on September 9, 2017
5.5 North China
269
area and has a depth of about 3.14–3.72 m. The monitoring well information and
specific measurement results of water level are shown in Table 5.84.
Figure 5.53 is the contour plot of the 1st layer of groundwater level drawn based
on data measured by the monitoring well on September 9, 2017 as well as the
measurement results of the long-term monitoring well in the region. It can be seen
from the figure that the 1st layer of groundwater generally flows from west to east in
the region where the landfill is located and has a hydraulic gradient of about 1‰.
b. The 2nd and 3rd layers of groundwater
The filed investigation also revealed the 2nd and 3rd layers of groundwater within
the 22.5 m depth range below the surface. Distribution of a water barrier layer, i.e.,
the silty clay and clayey silt layer ③ is identified between the roof of the 2nd
aquifer and the floor of the 1st aquifer. The barrier layer has a thickness of 6.3–
9.3 m and is distributed continuously Within landfill area.
Fig. 5.53 Contour map of groundwater level in the 1st layer in the greater region of the landfill
(Early September 2017)
Table 5.84 Monitoring well information and measurement results of the 1st layer of groundwater
level
Monitoring
well
number
Well
depth
(m)
Lithology and serial
number of water
occurrence stratum
Ground
elevation
(m)
Water
buried
depth
(m)
Water
level
elevation
(m)
MW1
#
7.00
Fine sand layer ②
19.60
2.78
16.82
MW2
#
4.50
17.75
0.86
16.89
Note The groundwater level at the monitoring wells was measured on September 9, 2017
5.5 North China
269