

(b) Groundwater quality evaluation
A group of water samples was taken in the monitoring hole in front of the refuse
dam for water quality monitoring and analysis using the standard index method.
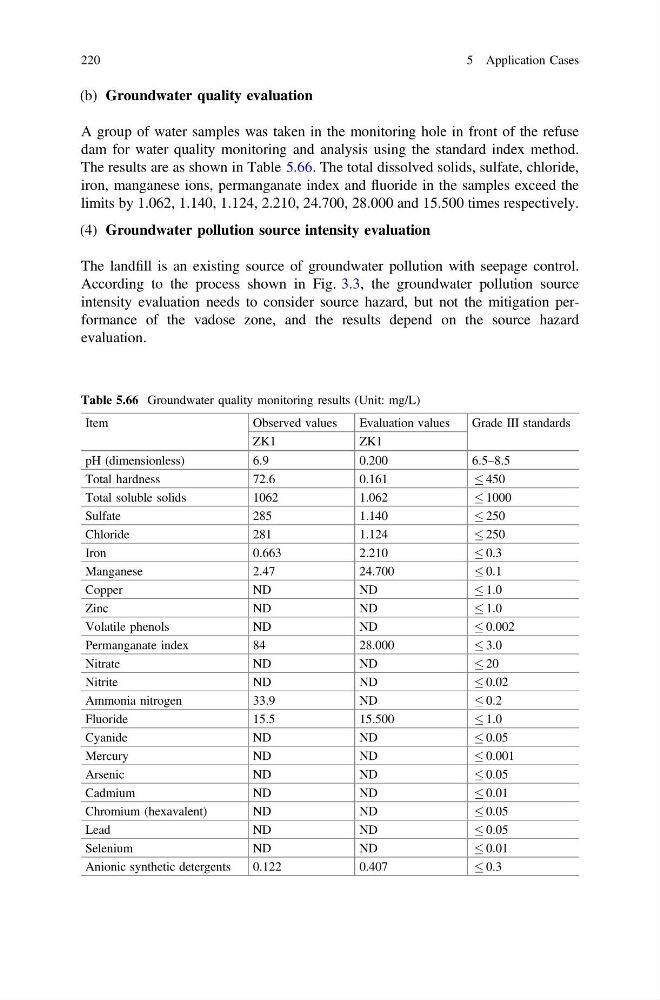
The results are as shown in Table 5.66. The total dissolved solids, sulfate, chloride,
iron, manganese ions, permanganate index and fluoride in the samples exceed the
limits by 1.062, 1.140, 1.124, 2.210, 24.700, 28.000 and 15.500 times respectively.
(4) Groundwater pollution source intensity evaluation
The landfill is an existing source of groundwater pollution with seepage control.
According to the process shown in Fig. 3.3, the groundwater pollution source
intensity evaluation needs to consider source hazard, but not the mitigation performance of the vadose zone, and the results depend on the source hazard
evaluation.
Table 5.66 Groundwater quality monitoring results (Unit: mg/L)
Item
Observed values
Evaluation values
Grade III standards
ZK1
ZK1
pH (dimensionless)
6.9
0.200
6.5–8.5
Total hardness
72.6
0.161
450
Total soluble solids
1062
1.062
1000
Sulfate
285
1.140
250
Chloride
281
1.124
250
Iron
0.663
2.210
0.3
Manganese
2.47
24.700
0.1
Copper
ND
ND
1.0
Zinc
ND
ND
1.0
Volatile phenols
ND
ND
0.002
Permanganate index
84
28.000
3.0
Nitrate
ND
ND
20
Nitrite
ND
ND
0.02
Ammonia nitrogen
33.9
ND
0.2
Fluoride
15.5
15.500
1.0
Cyanide
ND
ND
0.05
Mercury
ND
ND
0.001
Arsenic
ND
ND
0.05
Cadmium
ND
ND
0.01
Chromium (hexavalent)
ND
ND
0.05
Lead
ND
ND
0.05
Selenium
ND
ND
0.01
Anionic synthetic detergents
0.122
0.407
0.3
220
5 Application Cases
A group of water samples was taken in the monitoring hole in front of the refuse
dam for water quality monitoring and analysis using the standard index method.
The results are as shown in Table 5.66. The total dissolved solids, sulfate, chloride,
iron, manganese ions, permanganate index and fluoride in the samples exceed the
limits by 1.062, 1.140, 1.124, 2.210, 24.700, 28.000 and 15.500 times respectively.
(4) Groundwater pollution source intensity evaluation
The landfill is an existing source of groundwater pollution with seepage control.
According to the process shown in Fig. 3.3, the groundwater pollution source
intensity evaluation needs to consider source hazard, but not the mitigation performance of the vadose zone, and the results depend on the source hazard
evaluation.
Table 5.66 Groundwater quality monitoring results (Unit: mg/L)
Item
Observed values
Evaluation values
Grade III standards
ZK1
ZK1
pH (dimensionless)
6.9
0.200
6.5–8.5
Total hardness
72.6
0.161
450
Total soluble solids
1062
1.062
1000
Sulfate
285
1.140
250
Chloride
281
1.124
250
Iron
0.663
2.210
0.3
Manganese
2.47
24.700
0.1
Copper
ND
ND
1.0
Zinc
ND
ND
1.0
Volatile phenols
ND
ND
0.002
Permanganate index
84
28.000
3.0
Nitrate
ND
ND
20
Nitrite
ND
ND
0.02
Ammonia nitrogen
33.9
ND
0.2
Fluoride
15.5
15.500
1.0
Cyanide
ND
ND
0.05
Mercury
ND
ND
0.001
Arsenic
ND
ND
0.05
Cadmium
ND
ND
0.01
Chromium (hexavalent)
ND
ND
0.05
Lead
ND
ND
0.05
Selenium
ND
ND
0.01
Anionic synthetic detergents
0.122
0.407
0.3
220
5 Application Cases