

(b) Groundwater quality evaluation
In this survey, totally 10 groups of water samples were collected. Among them,
household wells Q1–Q5 are located in the upstream of the landfill and can be taken
for monitoring background values. As to the five monitoring wells, JK05 is located
in the southwest of the landfill, JK01 in the north, JK03 and JK04 in the south, and
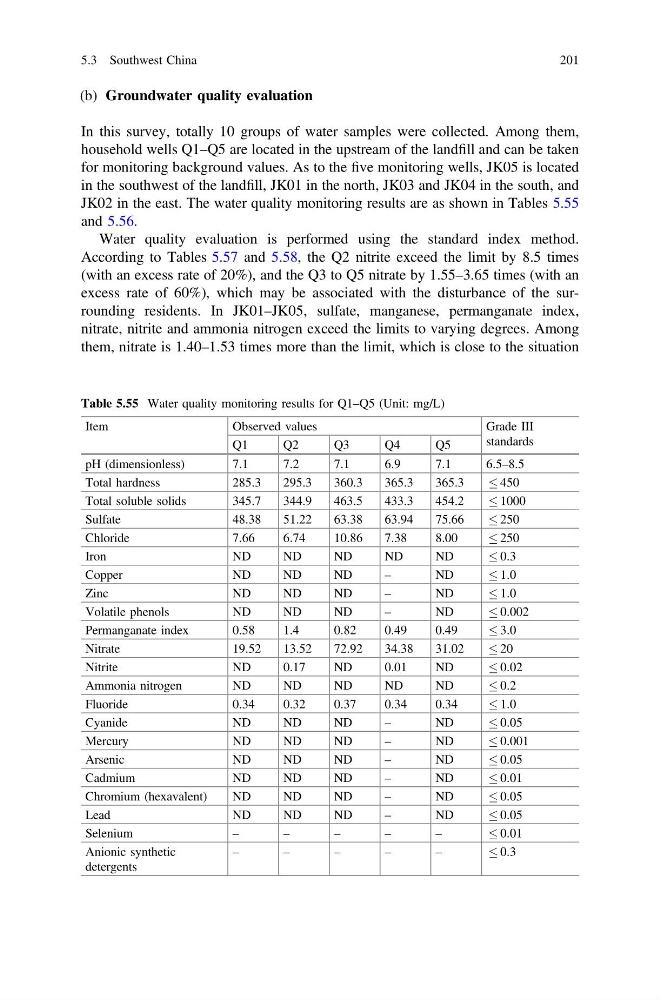
JK02 in the east. The water quality monitoring results are as shown in Tables 5.55
and 5.56.
Water quality evaluation is performed using the standard index method.
According to Tables 5.57 and 5.58, the Q2 nitrite exceed the limit by 8.5 times
(with an excess rate of 20%), and the Q3 to Q5 nitrate by 1.55–3.65 times (with an
excess rate of 60%), which may be associated with the disturbance of the surrounding residents. In JK01–JK05, sulfate, manganese, permanganate index,
nitrate, nitrite and ammonia nitrogen exceed the limits to varying degrees. Among
them, nitrate is 1.40–1.53 times more than the limit, which is close to the situation
Table 5.55 Water quality monitoring results for Q1–Q5 (Unit: mg/L)
Item
Observed values
Grade III
standards
Q1
Q2
Q3
Q4
Q5
pH (dimensionless)
7.1
7.2
7.1
6.9
7.1
6.5–8.5
Total hardness
285.3
295.3
360.3
365.3
365.3
450
Total soluble solids
345.7
344.9
463.5
433.3
454.2
1000
Sulfate
48.38
51.22
63.38
63.94
75.66
250
Chloride
7.66
6.74
10.86
7.38
8.00
250
Iron
ND
ND
ND
ND
ND
0.3
Copper
ND
ND
ND
–
ND
1.0
Zinc
ND
ND
ND
–
ND
1.0
Volatile phenols
ND
ND
ND
–
ND
0.002
Permanganate index
0.58
1.4
0.82
0.49
0.49
3.0
Nitrate
19.52
13.52
72.92
34.38
31.02
20
Nitrite
ND
0.17
ND
0.01
ND
0.02
Ammonia nitrogen
ND
ND
ND
ND
ND
0.2
Fluoride
0.34
0.32
0.37
0.34
0.34
1.0
Cyanide
ND
ND
ND
–
ND
0.05
Mercury
ND
ND
ND
–
ND
0.001
Arsenic
ND
ND
ND
–
ND
0.05
Cadmium
ND
ND
ND
–
ND
0.01
Chromium (hexavalent)
ND
ND
ND
–
ND
0.05
Lead
ND
ND
ND
–
ND
0.05
Selenium
–
–
–
–
–
0.01
Anionic synthetic
detergents
–
–
–
–
–
0.3
5.3 Southwest China
201
In this survey, totally 10 groups of water samples were collected. Among them,
household wells Q1–Q5 are located in the upstream of the landfill and can be taken
for monitoring background values. As to the five monitoring wells, JK05 is located
in the southwest of the landfill, JK01 in the north, JK03 and JK04 in the south, and
JK02 in the east. The water quality monitoring results are as shown in Tables 5.55
and 5.56.
Water quality evaluation is performed using the standard index method.
According to Tables 5.57 and 5.58, the Q2 nitrite exceed the limit by 8.5 times
(with an excess rate of 20%), and the Q3 to Q5 nitrate by 1.55–3.65 times (with an
excess rate of 60%), which may be associated with the disturbance of the surrounding residents. In JK01–JK05, sulfate, manganese, permanganate index,
nitrate, nitrite and ammonia nitrogen exceed the limits to varying degrees. Among
them, nitrate is 1.40–1.53 times more than the limit, which is close to the situation
Table 5.55 Water quality monitoring results for Q1–Q5 (Unit: mg/L)
Item
Observed values
Grade III
standards
Q1
Q2
Q3
Q4
Q5
pH (dimensionless)
7.1
7.2
7.1
6.9
7.1
6.5–8.5
Total hardness
285.3
295.3
360.3
365.3
365.3
450
Total soluble solids
345.7
344.9
463.5
433.3
454.2
1000
Sulfate
48.38
51.22
63.38
63.94
75.66
250
Chloride
7.66
6.74
10.86
7.38
8.00
250
Iron
ND
ND
ND
ND
ND
0.3
Copper
ND
ND
ND
–
ND
1.0
Zinc
ND
ND
ND
–
ND
1.0
Volatile phenols
ND
ND
ND
–
ND
0.002
Permanganate index
0.58
1.4
0.82
0.49
0.49
3.0
Nitrate
19.52
13.52
72.92
34.38
31.02
20
Nitrite
ND
0.17
ND
0.01
ND
0.02
Ammonia nitrogen
ND
ND
ND
ND
ND
0.2
Fluoride
0.34
0.32
0.37
0.34
0.34
1.0
Cyanide
ND
ND
ND
–
ND
0.05
Mercury
ND
ND
ND
–
ND
0.001
Arsenic
ND
ND
ND
–
ND
0.05
Cadmium
ND
ND
ND
–
ND
0.01
Chromium (hexavalent)
ND
ND
ND
–
ND
0.05
Lead
ND
ND
ND
–
ND
0.05
Selenium
–
–
–
–
–
0.01
Anionic synthetic
detergents
–
–
–
–
–
0.3
5.3 Southwest China
201