

• Results
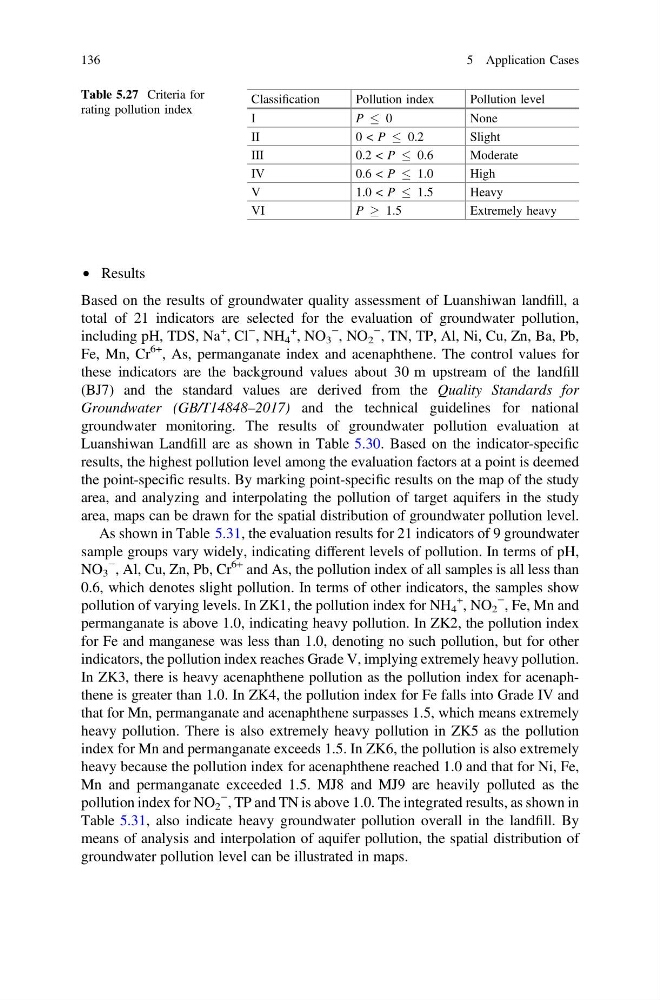
Based on the results of groundwater quality assessment of Luanshiwan landfill, a
total of 21 indicators are selected for the evaluation of groundwater pollution,
including pH, TDS, Na
+
, Cl
− , NH 4
+ , NO 3
− , NO 2
− , TN, TP, Al, Ni, Cu, Zn, Ba, Pb,
Fe, Mn, Cr
6+ , As, permanganate index and acenaphthene. The control values for
these indicators are the background values about 30 m upstream of the landfill
(BJ7) and the standard values are derived from the Quality Standards for
Groundwater (GB/T14848–2017) and the technical guidelines for national
groundwater monitoring. The results of groundwater pollution evaluation at
Luanshiwan Landfill are as shown in Table 5.30. Based on the indicator-specific
results, the highest pollution level among the evaluation factors at a point is deemed
the point-specific results. By marking point-specific results on the map of the study
area, and analyzing and interpolating the pollution of target aquifers in the study
area, maps can be drawn for the spatial distribution of groundwater pollution level.
As shown in Table 5.31, the evaluation results for 21 indicators of 9 groundwater
sample groups vary widely, indicating different levels of pollution. In terms of pH,
NO 3
− , Al, Cu, Zn, Pb, Cr
6+ and As, the pollution index of all samples is all less than
0.6, which denotes slight pollution. In terms of other indicators, the samples show
pollution of varying levels. In ZK1, the pollution index for NH 4
+
, NO 2
−
, Fe, Mn and
permanganate is above 1.0, indicating heavy pollution. In ZK2, the pollution index
for Fe and manganese was less than 1.0, denoting no such pollution, but for other
indicators, the pollution index reaches Grade V, implying extremely heavy pollution.
In ZK3, there is heavy acenaphthene pollution as the pollution index for acenaphthene is greater than 1.0. In ZK4, the pollution index for Fe falls into Grade IV and
that for Mn, permanganate and acenaphthene surpasses 1.5, which means extremely
heavy pollution. There is also extremely heavy pollution in ZK5 as the pollution
index for Mn and permanganate exceeds 1.5. In ZK6, the pollution is also extremely
heavy because the pollution index for acenaphthene reached 1.0 and that for Ni, Fe,
Mn and permanganate exceeded 1.5. MJ8 and MJ9 are heavily polluted as the
pollution index for NO 2
− , TP and TN is above 1.0. The integrated results, as shown in
Table 5.31, also indicate heavy groundwater pollution overall in the landfill. By
means of analysis and interpolation of aquifer pollution, the spatial distribution of
groundwater pollution level can be illustrated in maps.
Table 5.27 Criteria for
rating pollution index
Classification
Pollution index
Pollution level
I
P
0
None
II
0 < P
0.2
Slight
III
0.2 < P
0.6
Moderate
IV
0.6 < P
1.0
High
V
1.0 < P
1.5
Heavy
VI
P ! 1.5
Extremely heavy
136
5 Application Cases
Based on the results of groundwater quality assessment of Luanshiwan landfill, a
total of 21 indicators are selected for the evaluation of groundwater pollution,
including pH, TDS, Na
+
, Cl
− , NH 4
+ , NO 3
− , NO 2
− , TN, TP, Al, Ni, Cu, Zn, Ba, Pb,
Fe, Mn, Cr
6+ , As, permanganate index and acenaphthene. The control values for
these indicators are the background values about 30 m upstream of the landfill
(BJ7) and the standard values are derived from the Quality Standards for
Groundwater (GB/T14848–2017) and the technical guidelines for national
groundwater monitoring. The results of groundwater pollution evaluation at
Luanshiwan Landfill are as shown in Table 5.30. Based on the indicator-specific
results, the highest pollution level among the evaluation factors at a point is deemed
the point-specific results. By marking point-specific results on the map of the study
area, and analyzing and interpolating the pollution of target aquifers in the study
area, maps can be drawn for the spatial distribution of groundwater pollution level.
As shown in Table 5.31, the evaluation results for 21 indicators of 9 groundwater
sample groups vary widely, indicating different levels of pollution. In terms of pH,
NO 3
− , Al, Cu, Zn, Pb, Cr
6+ and As, the pollution index of all samples is all less than
0.6, which denotes slight pollution. In terms of other indicators, the samples show
pollution of varying levels. In ZK1, the pollution index for NH 4
+
, NO 2
−
, Fe, Mn and
permanganate is above 1.0, indicating heavy pollution. In ZK2, the pollution index
for Fe and manganese was less than 1.0, denoting no such pollution, but for other
indicators, the pollution index reaches Grade V, implying extremely heavy pollution.
In ZK3, there is heavy acenaphthene pollution as the pollution index for acenaphthene is greater than 1.0. In ZK4, the pollution index for Fe falls into Grade IV and
that for Mn, permanganate and acenaphthene surpasses 1.5, which means extremely
heavy pollution. There is also extremely heavy pollution in ZK5 as the pollution
index for Mn and permanganate exceeds 1.5. In ZK6, the pollution is also extremely
heavy because the pollution index for acenaphthene reached 1.0 and that for Ni, Fe,
Mn and permanganate exceeded 1.5. MJ8 and MJ9 are heavily polluted as the
pollution index for NO 2
− , TP and TN is above 1.0. The integrated results, as shown in
Table 5.31, also indicate heavy groundwater pollution overall in the landfill. By
means of analysis and interpolation of aquifer pollution, the spatial distribution of
groundwater pollution level can be illustrated in maps.
Table 5.27 Criteria for
rating pollution index
Classification
Pollution index
Pollution level
I
P
0
None
II
0 < P
0.2
Slight
III
0.2 < P
0.6
Moderate
IV
0.6 < P
1.0
High
V
1.0 < P
1.5
Heavy
VI
P ! 1.5
Extremely heavy
136
5 Application Cases