

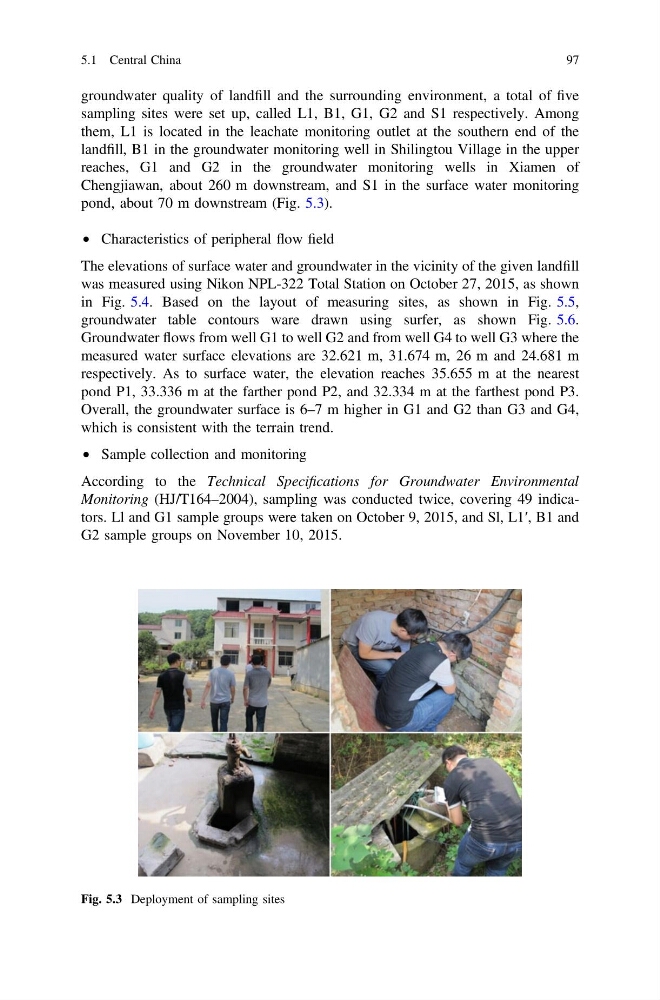
groundwater quality of landfill and the surrounding environment, a total of five
sampling sites were set up, called L1, B1, G1, G2 and S1 respectively. Among
them, L1 is located in the leachate monitoring outlet at the southern end of the
landfill, B1 in the groundwater monitoring well in Shilingtou Village in the upper
reaches, G1 and G2 in the groundwater monitoring wells in Xiamen of
Chengjiawan, about 260 m downstream, and S1 in the surface water monitoring
pond, about 70 m downstream (Fig. 5.3).
• Characteristics of peripheral flow field
The elevations of surface water and groundwater in the vicinity of the given landfill
was measured using Nikon NPL-322 Total Station on October 27, 2015, as shown
in Fig. 5.4. Based on the layout of measuring sites, as shown in Fig. 5.5,
groundwater table contours ware drawn using surfer, as shown Fig. 5.6.
Groundwater flows from well G1 to well G2 and from well G4 to well G3 where the
measured water surface elevations are 32.621 m, 31.674 m, 26 m and 24.681 m
respectively. As to surface water, the elevation reaches 35.655 m at the nearest
pond P1, 33.336 m at the farther pond P2, and 32.334 m at the farthest pond P3.
Overall, the groundwater surface is 6–7 m higher in G1 and G2 than G3 and G4,
which is consistent with the terrain trend.
• Sample collection and monitoring
According to the Technical Specifications for Groundwater Environmental
Monitoring (HJ/T164–2004), sampling was conducted twice, covering 49 indicators. Ll and G1 sample groups were taken on October 9, 2015, and Sl, L1′, B1 and
G2 sample groups on November 10, 2015.
Fig. 5.3 Deployment of sampling sites
5.1 Central China
97
sampling sites were set up, called L1, B1, G1, G2 and S1 respectively. Among
them, L1 is located in the leachate monitoring outlet at the southern end of the
landfill, B1 in the groundwater monitoring well in Shilingtou Village in the upper
reaches, G1 and G2 in the groundwater monitoring wells in Xiamen of
Chengjiawan, about 260 m downstream, and S1 in the surface water monitoring
pond, about 70 m downstream (Fig. 5.3).
• Characteristics of peripheral flow field
The elevations of surface water and groundwater in the vicinity of the given landfill
was measured using Nikon NPL-322 Total Station on October 27, 2015, as shown
in Fig. 5.4. Based on the layout of measuring sites, as shown in Fig. 5.5,
groundwater table contours ware drawn using surfer, as shown Fig. 5.6.
Groundwater flows from well G1 to well G2 and from well G4 to well G3 where the
measured water surface elevations are 32.621 m, 31.674 m, 26 m and 24.681 m
respectively. As to surface water, the elevation reaches 35.655 m at the nearest
pond P1, 33.336 m at the farther pond P2, and 32.334 m at the farthest pond P3.
Overall, the groundwater surface is 6–7 m higher in G1 and G2 than G3 and G4,
which is consistent with the terrain trend.
• Sample collection and monitoring
According to the Technical Specifications for Groundwater Environmental
Monitoring (HJ/T164–2004), sampling was conducted twice, covering 49 indicators. Ll and G1 sample groups were taken on October 9, 2015, and Sl, L1′, B1 and
G2 sample groups on November 10, 2015.
Fig. 5.3 Deployment of sampling sites
5.1 Central China
97