

320
F. E. K. Sato and T. Nakata
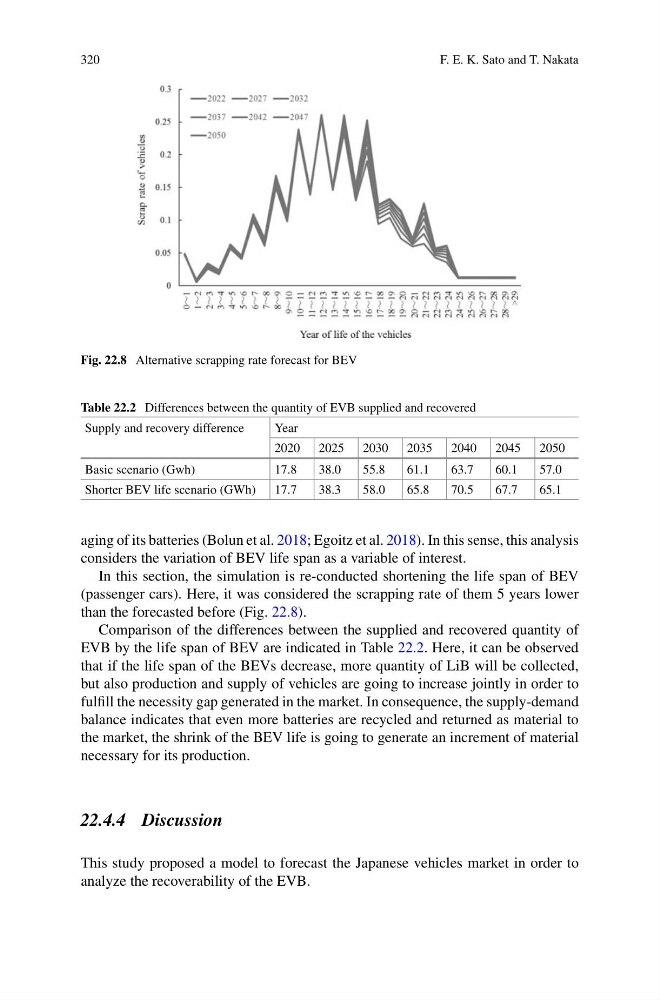
Fig. 22.8 Alternative scrapping rate forecast for BEV
Table 22.2 Differences between the quantity of EVB supplied and recovered
Supply and recovery difference
Year
2020 2025 2030 2035 2040 2045 2050
Basic scenario (Gwh)
17.8
38.0
55.8
61.1
63.7
60.1
57.0
Shorter BEV life scenario (GWh) 17.7
38.3
58.0
65.8
70.5
67.7
65.1
aging of its batteries (Bolun et al. 2018; Egoitz et al. 2018). In this sense, this analysis
considers the variation of BEV life span as a variable of interest.
In this section, the simulation is re-conducted shortening the life span of BEV
(passenger cars). Here, it was considered the scrapping rate of them 5 years lower
than the forecasted before (Fig. 22.8).
Comparison of the differences between the supplied and recovered quantity of
EVB by the life span of BEV are indicated in Table 22.2. Here, it can be observed
that if the life span of the BEVs decrease, more quantity of LiB will be collected,
but also production and supply of vehicles are going to increase jointly in order to
fulfill the necessity gap generated in the market. In consequence, the supply-demand
balance indicates that even more batteries are recycled and returned as material to
the market, the shrink of the BEV life is going to generate an increment of material
necessary for its production.
22.4.4 Discussion
This study proposed a model to forecast the Japanese vehicles market in order to
analyze the recoverability of the EVB.
F. E. K. Sato and T. Nakata
Fig. 22.8 Alternative scrapping rate forecast for BEV
Table 22.2 Differences between the quantity of EVB supplied and recovered
Supply and recovery difference
Year
2020 2025 2030 2035 2040 2045 2050
Basic scenario (Gwh)
17.8
38.0
55.8
61.1
63.7
60.1
57.0
Shorter BEV life scenario (GWh) 17.7
38.3
58.0
65.8
70.5
67.7
65.1
aging of its batteries (Bolun et al. 2018; Egoitz et al. 2018). In this sense, this analysis
considers the variation of BEV life span as a variable of interest.
In this section, the simulation is re-conducted shortening the life span of BEV
(passenger cars). Here, it was considered the scrapping rate of them 5 years lower
than the forecasted before (Fig. 22.8).
Comparison of the differences between the supplied and recovered quantity of
EVB by the life span of BEV are indicated in Table 22.2. Here, it can be observed
that if the life span of the BEVs decrease, more quantity of LiB will be collected,
but also production and supply of vehicles are going to increase jointly in order to
fulfill the necessity gap generated in the market. In consequence, the supply-demand
balance indicates that even more batteries are recycled and returned as material to
the market, the shrink of the BEV life is going to generate an increment of material
necessary for its production.
22.4.4 Discussion
This study proposed a model to forecast the Japanese vehicles market in order to
analyze the recoverability of the EVB.