

314
F. E. K. Sato and T. Nakata
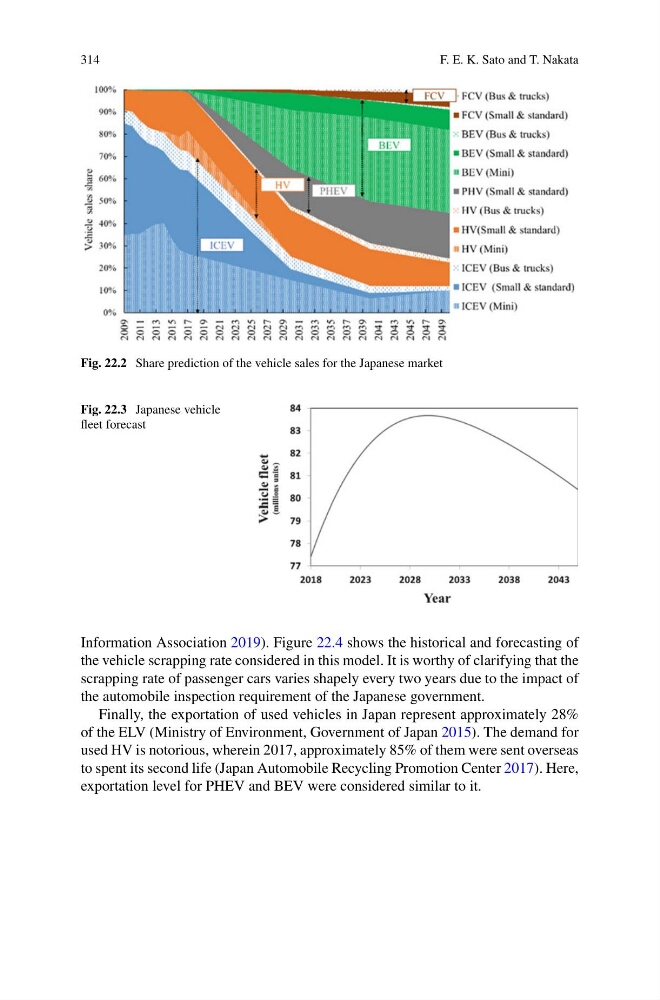
Fig. 22.2 Share prediction of the vehicle sales for the Japanese market
Fig. 22.3 Japanese vehicle
fleet forecast
Information Association 2019). Figure 22.4 shows the historical and forecasting of
the vehicle scrapping rate considered in this model. It is worthy of clarifying that the
scrapping rate of passenger cars varies shapely every two years due to the impact of
the automobile inspection requirement of the Japanese government.
Finally, the exportation of used vehicles in Japan represent approximately 28%
of the ELV (Ministry of Environment, Government of Japan 2015). The demand for
used HV is notorious, wherein 2017, approximately 85% of them were sent overseas
to spent its second life (Japan Automobile Recycling Promotion Center 2017). Here,
exportation level for PHEV and BEV were considered similar to it.
F. E. K. Sato and T. Nakata
Fig. 22.2 Share prediction of the vehicle sales for the Japanese market
Fig. 22.3 Japanese vehicle
fleet forecast
Information Association 2019). Figure 22.4 shows the historical and forecasting of
the vehicle scrapping rate considered in this model. It is worthy of clarifying that the
scrapping rate of passenger cars varies shapely every two years due to the impact of
the automobile inspection requirement of the Japanese government.
Finally, the exportation of used vehicles in Japan represent approximately 28%
of the ELV (Ministry of Environment, Government of Japan 2015). The demand for
used HV is notorious, wherein 2017, approximately 85% of them were sent overseas
to spent its second life (Japan Automobile Recycling Promotion Center 2017). Here,
exportation level for PHEV and BEV were considered similar to it.