

The odds of households of receiving income from the availability of gardens were
1.299 (Table 14.5). This will in turn lead to higher food security levels and enhance
the odds of households being food secure. The odds of households with irrigation
water to have available garden were 1.29. This is true as agricultural production
requires large quantities of good quality water for use in various production processes. According to the FAO (2012), irrigation uses up to 70% of all fresh water
appropriated for human use. According to Table 14.5, the odds of households with
garden tools to have an available garden was 1.07. Obviously, in order to grow crops
in the garden, tools play an important role. The odds of agricultural training and
available gardens were 1.25. This is true as non-formal and formal education plays
an important role in household/smallholder farmer involvement in agriculture.
Finally, it is not surprising to realise the association between the homestead garden
Very Good
Good
Fair
Poor
Very Poor
Total
City of Johannesburg
210
85
21
2
1
319
City of Tshwane
216
31
15
4
4
270
Ekurhuleni
2
9
92
25
13
141
Sedibeng
4
193
17
2
0
216
West Rand
11
23
21
72
77
204
Gauteng
443
341
166
105
95
1150
0
200
400
600
800
1000
1200
1400
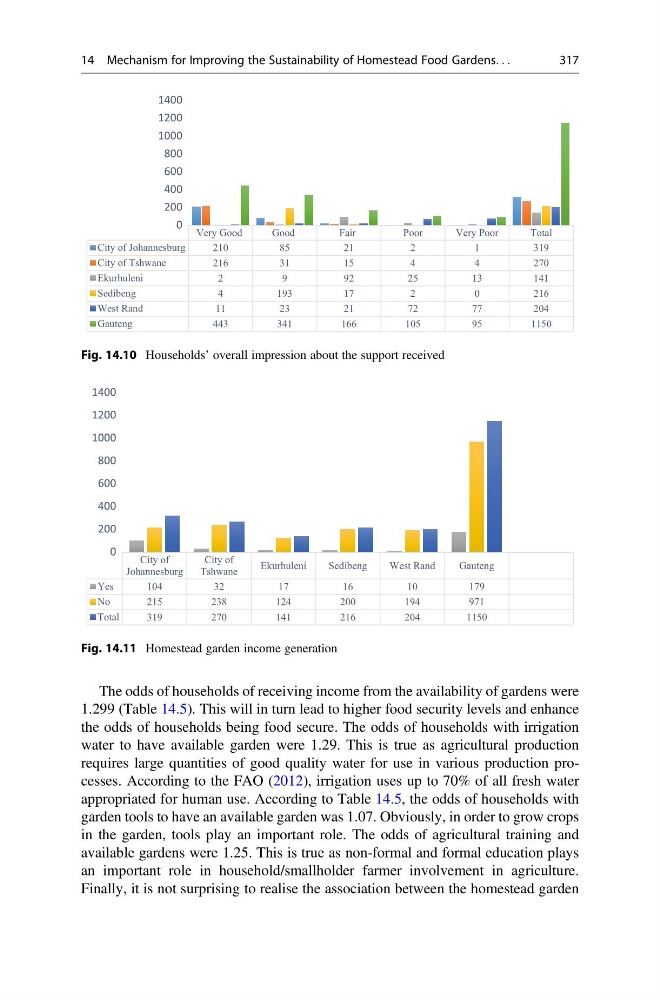
Fig. 14.10 Households’ overall impression about the support received
City of
Johannesburg
City of
Tshwane
Ekurhuleni
Sedibeng
West Rand
Gauteng
Yes
104
32
17
16
10
179
No
2 1 5
2 3 8
1 2 4
2 0 0
1 9 4
9 7 1
Total
3 1 9
2 7 0
1 4 1
2 1 6
2 0 4
1 1 5 0
0
200
400
600
800
1000
1200
1400
Fig. 14.11 Homestead garden income generation
14 Mechanism for Improving the Sustainability of Homestead Food Gardens. . .
317
1.299 (Table 14.5). This will in turn lead to higher food security levels and enhance
the odds of households being food secure. The odds of households with irrigation
water to have available garden were 1.29. This is true as agricultural production
requires large quantities of good quality water for use in various production processes. According to the FAO (2012), irrigation uses up to 70% of all fresh water
appropriated for human use. According to Table 14.5, the odds of households with
garden tools to have an available garden was 1.07. Obviously, in order to grow crops
in the garden, tools play an important role. The odds of agricultural training and
available gardens were 1.25. This is true as non-formal and formal education plays
an important role in household/smallholder farmer involvement in agriculture.
Finally, it is not surprising to realise the association between the homestead garden
Very Good
Good
Fair
Poor
Very Poor
Total
City of Johannesburg
210
85
21
2
1
319
City of Tshwane
216
31
15
4
4
270
Ekurhuleni
2
9
92
25
13
141
Sedibeng
4
193
17
2
0
216
West Rand
11
23
21
72
77
204
Gauteng
443
341
166
105
95
1150
0
200
400
600
800
1000
1200
1400
Fig. 14.10 Households’ overall impression about the support received
City of
Johannesburg
City of
Tshwane
Ekurhuleni
Sedibeng
West Rand
Gauteng
Yes
104
32
17
16
10
179
No
2 1 5
2 3 8
1 2 4
2 0 0
1 9 4
9 7 1
Total
3 1 9
2 7 0
1 4 1
2 1 6
2 0 4
1 1 5 0
0
200
400
600
800
1000
1200
1400
Fig. 14.11 Homestead garden income generation
14 Mechanism for Improving the Sustainability of Homestead Food Gardens. . .
317