

Conclusions
In this study, the GIS technique is used to delineate the LULC of various land classes
and to examine their dynamics. From the study, an increase and decrease of various
LULC classes of the Koraiyar basin from 1986 to 2016 were observed. During this
period, it is noted that the settlement area increased by 104.74% and water bodies
decreased by 11.45%. A decrease in agricultural land of about 12.29% is observed
for the past 30 years, whereas open denuded land has increased. This increase in
open land is the result of noncultivation of agricultural lands during the
non-monsoon season and the practice of cultivation for more extended periods at
other times, which is verified by field observations. The Markov model is used for
predicting the future trend of LULC dynamics. The model not only accurately
describes the past and present changes but also predicts probable future land use
changes. The simulation trend shows that the overall increase in a built-up area is
predicted to be 7.17% from 1986 to 2036. The CN-generated results show a
continued increase in the CN values from the past to the present, and this increase
proves the associated increase in peak runoff rates and total runoff volume. The
30-m resolution DEM data were used for delineation of the Koraiyar basin and its
catchment characteristics by using HEC-GeoHMS, an Arc Hydro extension in
ArcGIS. The soil and LULC data are used to generate the CN and analyze its
influence on runoff in the basin. The HEC-HMS hydrologic modeling software is
adopted in the basin to predict flood peak runoff and volume. In the metrological
model of HEC-HMS, the frequency storm method is adopted for selected extreme
events. From the LULC analysis of the basin, it is noted that a 1.4% increase in the
settlement area of the whole basin led to an increase of 3% in the runoff rate. The
analysis of LULC changes shows that the basin has only a marginal increase in
settlement, and open land results in a marginal increase in the runoff and volume of
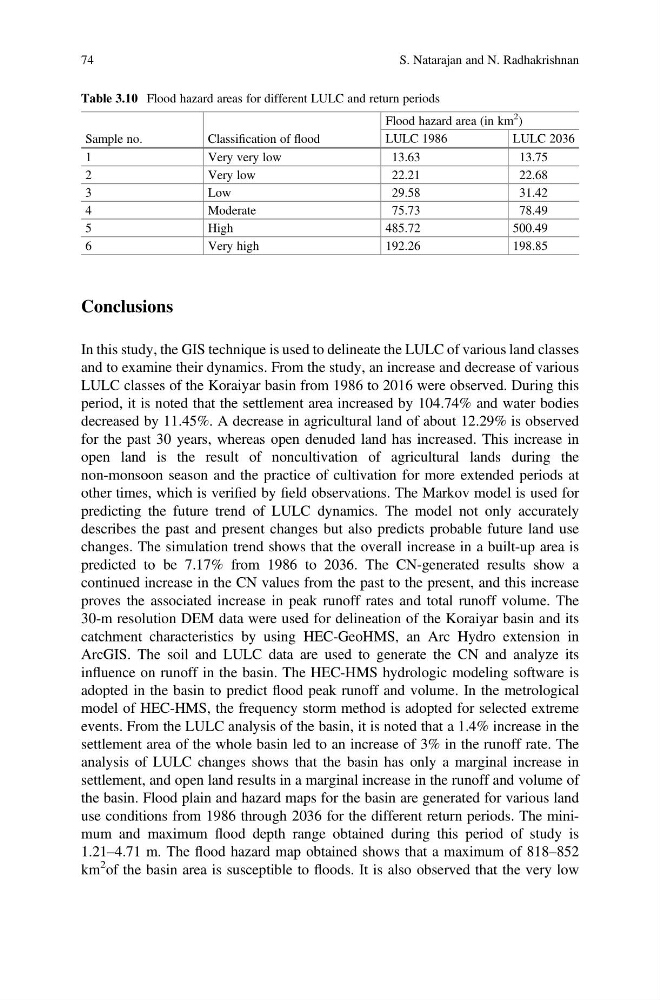
the basin. Flood plain and hazard maps for the basin are generated for various land
use conditions from 1986 through 2036 for the different return periods. The minimum and maximum flood depth range obtained during this period of study is
1.21–4.71 m. The flood hazard map obtained shows that a maximum of 818–852
km
2 of the basin area is susceptible to floods. It is also observed that the very low
Table 3.10 Flood hazard areas for different LULC and return periods
Sample no.
Classification of flood
Flood hazard area (in km
2
)
LULC 1986
LULC 2036
1
Very very low
13.63
13.75
2
Very low
22.21
22.68
3
Low
29.58
31.42
4
Moderate
75.73
78.49
5
High
485.72
500.49
6
Very high
192.26
198.85
74
S. Natarajan and N. Radhakrishnan
In this study, the GIS technique is used to delineate the LULC of various land classes
and to examine their dynamics. From the study, an increase and decrease of various
LULC classes of the Koraiyar basin from 1986 to 2016 were observed. During this
period, it is noted that the settlement area increased by 104.74% and water bodies
decreased by 11.45%. A decrease in agricultural land of about 12.29% is observed
for the past 30 years, whereas open denuded land has increased. This increase in
open land is the result of noncultivation of agricultural lands during the
non-monsoon season and the practice of cultivation for more extended periods at
other times, which is verified by field observations. The Markov model is used for
predicting the future trend of LULC dynamics. The model not only accurately
describes the past and present changes but also predicts probable future land use
changes. The simulation trend shows that the overall increase in a built-up area is
predicted to be 7.17% from 1986 to 2036. The CN-generated results show a
continued increase in the CN values from the past to the present, and this increase
proves the associated increase in peak runoff rates and total runoff volume. The
30-m resolution DEM data were used for delineation of the Koraiyar basin and its
catchment characteristics by using HEC-GeoHMS, an Arc Hydro extension in
ArcGIS. The soil and LULC data are used to generate the CN and analyze its
influence on runoff in the basin. The HEC-HMS hydrologic modeling software is
adopted in the basin to predict flood peak runoff and volume. In the metrological
model of HEC-HMS, the frequency storm method is adopted for selected extreme
events. From the LULC analysis of the basin, it is noted that a 1.4% increase in the
settlement area of the whole basin led to an increase of 3% in the runoff rate. The
analysis of LULC changes shows that the basin has only a marginal increase in
settlement, and open land results in a marginal increase in the runoff and volume of
the basin. Flood plain and hazard maps for the basin are generated for various land
use conditions from 1986 through 2036 for the different return periods. The minimum and maximum flood depth range obtained during this period of study is
1.21–4.71 m. The flood hazard map obtained shows that a maximum of 818–852
km
2 of the basin area is susceptible to floods. It is also observed that the very low
Table 3.10 Flood hazard areas for different LULC and return periods
Sample no.
Classification of flood
Flood hazard area (in km
2
)
LULC 1986
LULC 2036
1
Very very low
13.63
13.75
2
Very low
22.21
22.68
3
Low
29.58
31.42
4
Moderate
75.73
78.49
5
High
485.72
500.49
6
Very high
192.26
198.85
74
S. Natarajan and N. Radhakrishnan