

Generation of Floodplain Maps
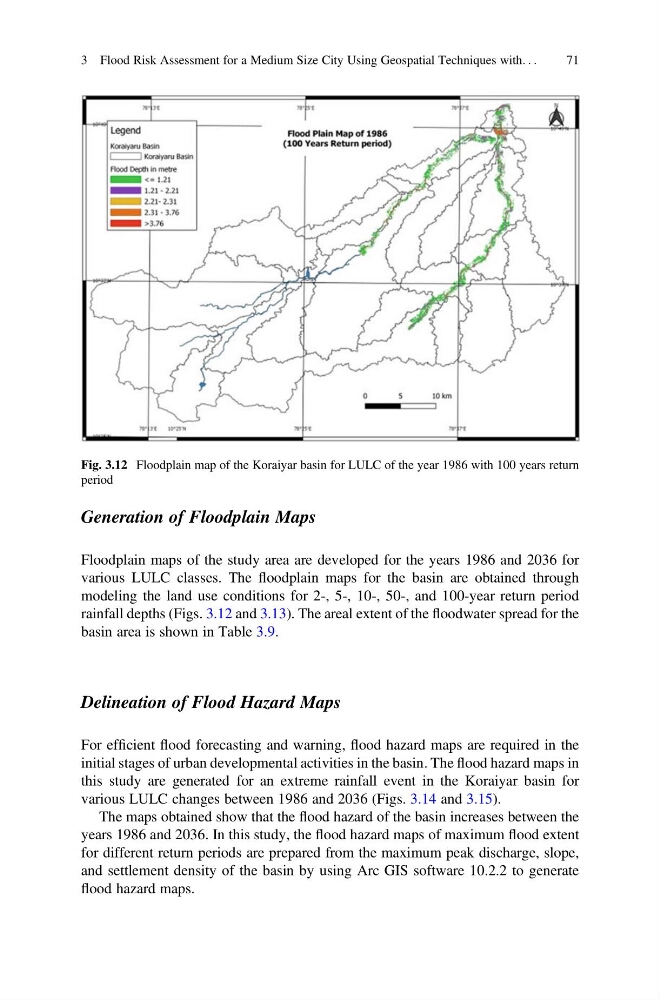
Floodplain maps of the study area are developed for the years 1986 and 2036 for
various LULC classes. The floodplain maps for the basin are obtained through
modeling the land use conditions for 2-, 5-, 10-, 50-, and 100-year return period
rainfall depths (Figs. 3.12 and 3.13). The areal extent of the floodwater spread for the
basin area is shown in Table 3.9.
Delineation of Flood Hazard Maps
For efficient flood forecasting and warning, flood hazard maps are required in the
initial stages of urban developmental activities in the basin. The flood hazard maps in
this study are generated for an extreme rainfall event in the Koraiyar basin for
various LULC changes between 1986 and 2036 (Figs. 3.14 and 3.15).
The maps obtained show that the flood hazard of the basin increases between the
years 1986 and 2036. In this study, the flood hazard maps of maximum flood extent
for different return periods are prepared from the maximum peak discharge, slope,
and settlement density of the basin by using Arc GIS software 10.2.2 to generate
flood hazard maps.
Fig. 3.12 Floodplain map of the Koraiyar basin for LULC of the year 1986 with 100 years return
period
3 Flood Risk Assessment for a Medium Size City Using Geospatial Techniques with. . .
71
Floodplain maps of the study area are developed for the years 1986 and 2036 for
various LULC classes. The floodplain maps for the basin are obtained through
modeling the land use conditions for 2-, 5-, 10-, 50-, and 100-year return period
rainfall depths (Figs. 3.12 and 3.13). The areal extent of the floodwater spread for the
basin area is shown in Table 3.9.
Delineation of Flood Hazard Maps
For efficient flood forecasting and warning, flood hazard maps are required in the
initial stages of urban developmental activities in the basin. The flood hazard maps in
this study are generated for an extreme rainfall event in the Koraiyar basin for
various LULC changes between 1986 and 2036 (Figs. 3.14 and 3.15).
The maps obtained show that the flood hazard of the basin increases between the
years 1986 and 2036. In this study, the flood hazard maps of maximum flood extent
for different return periods are prepared from the maximum peak discharge, slope,
and settlement density of the basin by using Arc GIS software 10.2.2 to generate
flood hazard maps.
Fig. 3.12 Floodplain map of the Koraiyar basin for LULC of the year 1986 with 100 years return
period
3 Flood Risk Assessment for a Medium Size City Using Geospatial Techniques with. . .
71