

T lag ¼ 0:6 Ã T c
ð3:9Þ
T c ¼
L
0:8 S þ 1
ð
Þ
0:7
1900
ffiffiffi ffi
Y
p
ð3:10Þ
The frequency storm data are used in the meteorological model. The frequency
storm method is used for producing rainfall depth for different return periods. The
selected extreme event rainfall is given as input to the HEC-HMS model, and control
specifications are used to define the time interval for model simulation. In this study,
an extreme rainfall event that occurred on 22 November 1999 is used for simulating
rainfall runoff in the present land use conditions to find the effect of LULC changes
and the impact on surface runoff. The Muskingum routing method is adopted to
route the water movement in the reach. The expected output from the model is the
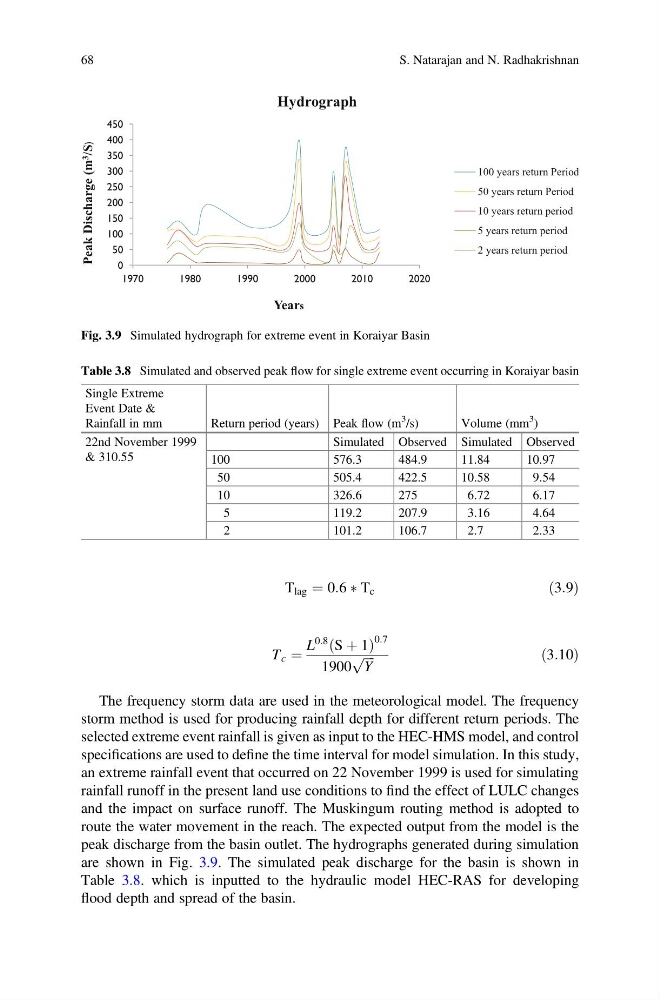
peak discharge from the basin outlet. The hydrographs generated during simulation
are shown in Fig. 3.9. The simulated peak discharge for the basin is shown in
Table 3.8. which is inputted to the hydraulic model HEC-RAS for developing
flood depth and spread of the basin.
Peak Discharge (m 3
/S)
Years
Hydrograph
100 years return Period
50 years return Period
10 years return period
5 years return period
2 years return period
Fig. 3.9 Simulated hydrograph for extreme event in Koraiyar Basin
Table 3.8 Simulated and observed peak flow for single extreme event occurring in Koraiyar basin
Single Extreme
Event Date &
Rainfall in mm
Return period (years) Peak flow (m
3
/s)
Volume (mm
3
)
22nd November 1999
& 310.55
Simulated Observed Simulated Observed
100
576.3
484.9
11.84
10.97
50
505.4
422.5
10.58
9.54
10
326.6
275
6.72
6.17
5
119.2
207.9
3.16
4.64
2
101.2
106.7
2.7
2.33
68
S. Natarajan and N. Radhakrishnan
ð3:9Þ
T c ¼
L
0:8 S þ 1
ð
Þ
0:7
1900
ffiffiffi ffi
Y
p
ð3:10Þ
The frequency storm data are used in the meteorological model. The frequency
storm method is used for producing rainfall depth for different return periods. The
selected extreme event rainfall is given as input to the HEC-HMS model, and control
specifications are used to define the time interval for model simulation. In this study,
an extreme rainfall event that occurred on 22 November 1999 is used for simulating
rainfall runoff in the present land use conditions to find the effect of LULC changes
and the impact on surface runoff. The Muskingum routing method is adopted to
route the water movement in the reach. The expected output from the model is the
peak discharge from the basin outlet. The hydrographs generated during simulation
are shown in Fig. 3.9. The simulated peak discharge for the basin is shown in
Table 3.8. which is inputted to the hydraulic model HEC-RAS for developing
flood depth and spread of the basin.
Peak Discharge (m 3
/S)
Years
Hydrograph
100 years return Period
50 years return Period
10 years return period
5 years return period
2 years return period
Fig. 3.9 Simulated hydrograph for extreme event in Koraiyar Basin
Table 3.8 Simulated and observed peak flow for single extreme event occurring in Koraiyar basin
Single Extreme
Event Date &
Rainfall in mm
Return period (years) Peak flow (m
3
/s)
Volume (mm
3
)
22nd November 1999
& 310.55
Simulated Observed Simulated Observed
100
576.3
484.9
11.84
10.97
50
505.4
422.5
10.58
9.54
10
326.6
275
6.72
6.17
5
119.2
207.9
3.16
4.64
2
101.2
106.7
2.7
2.33
68
S. Natarajan and N. Radhakrishnan