

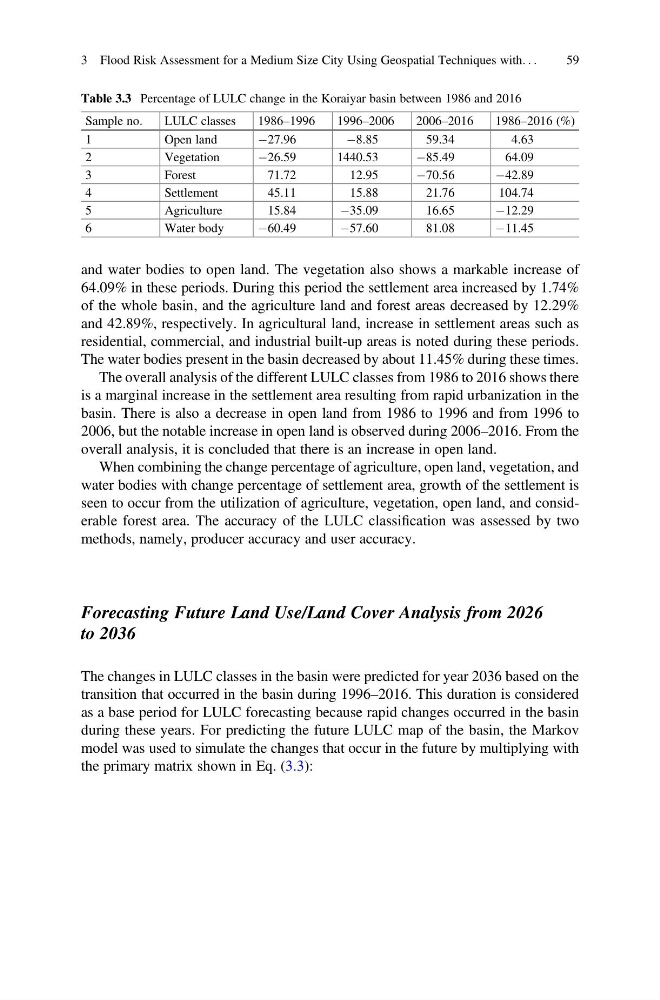
and water bodies to open land. The vegetation also shows a markable increase of
64.09% in these periods. During this period the settlement area increased by 1.74%
of the whole basin, and the agriculture land and forest areas decreased by 12.29%
and 42.89%, respectively. In agricultural land, increase in settlement areas such as
residential, commercial, and industrial built-up areas is noted during these periods.
The water bodies present in the basin decreased by about 11.45% during these times.
The overall analysis of the different LULC classes from 1986 to 2016 shows there
is a marginal increase in the settlement area resulting from rapid urbanization in the
basin. There is also a decrease in open land from 1986 to 1996 and from 1996 to
2006, but the notable increase in open land is observed during 2006–2016. From the
overall analysis, it is concluded that there is an increase in open land.
When combining the change percentage of agriculture, open land, vegetation, and
water bodies with change percentage of settlement area, growth of the settlement is
seen to occur from the utilization of agriculture, vegetation, open land, and considerable forest area. The accuracy of the LULC classification was assessed by two
methods, namely, producer accuracy and user accuracy.
Forecasting Future Land Use/Land Cover Analysis from 2026
to 2036
The changes in LULC classes in the basin were predicted for year 2036 based on the
transition that occurred in the basin during 1996–2016. This duration is considered
as a base period for LULC forecasting because rapid changes occurred in the basin
during these years. For predicting the future LULC map of the basin, the Markov
model was used to simulate the changes that occur in the future by multiplying with
the primary matrix shown in Eq. (3.3):
Table 3.3 Percentage of LULC change in the Koraiyar basin between 1986 and 2016
Sample no.
LULC classes
1986–1996
1996–2006
2006–2016
1986–2016 (%)
1
Open land
À27.96
À8.85
59.34
4.63
2
Vegetation
À26.59
1440.53
À85.49
64.09
3
Forest
71.72
12.95
À70.56
À42.89
4
Settlement
45.11
15.88
21.76
104.74
5
Agriculture
15.84
À35.09
16.65
À12.29
6
Water body
À60.49
À57.60
81.08
À11.45
3 Flood Risk Assessment for a Medium Size City Using Geospatial Techniques with. . .
59
64.09% in these periods. During this period the settlement area increased by 1.74%
of the whole basin, and the agriculture land and forest areas decreased by 12.29%
and 42.89%, respectively. In agricultural land, increase in settlement areas such as
residential, commercial, and industrial built-up areas is noted during these periods.
The water bodies present in the basin decreased by about 11.45% during these times.
The overall analysis of the different LULC classes from 1986 to 2016 shows there
is a marginal increase in the settlement area resulting from rapid urbanization in the
basin. There is also a decrease in open land from 1986 to 1996 and from 1996 to
2006, but the notable increase in open land is observed during 2006–2016. From the
overall analysis, it is concluded that there is an increase in open land.
When combining the change percentage of agriculture, open land, vegetation, and
water bodies with change percentage of settlement area, growth of the settlement is
seen to occur from the utilization of agriculture, vegetation, open land, and considerable forest area. The accuracy of the LULC classification was assessed by two
methods, namely, producer accuracy and user accuracy.
Forecasting Future Land Use/Land Cover Analysis from 2026
to 2036
The changes in LULC classes in the basin were predicted for year 2036 based on the
transition that occurred in the basin during 1996–2016. This duration is considered
as a base period for LULC forecasting because rapid changes occurred in the basin
during these years. For predicting the future LULC map of the basin, the Markov
model was used to simulate the changes that occur in the future by multiplying with
the primary matrix shown in Eq. (3.3):
Table 3.3 Percentage of LULC change in the Koraiyar basin between 1986 and 2016
Sample no.
LULC classes
1986–1996
1996–2006
2006–2016
1986–2016 (%)
1
Open land
À27.96
À8.85
59.34
4.63
2
Vegetation
À26.59
1440.53
À85.49
64.09
3
Forest
71.72
12.95
À70.56
À42.89
4
Settlement
45.11
15.88
21.76
104.74
5
Agriculture
15.84
À35.09
16.65
À12.29
6
Water body
À60.49
À57.60
81.08
À11.45
3 Flood Risk Assessment for a Medium Size City Using Geospatial Techniques with. . .
59