

Rainfall Projections
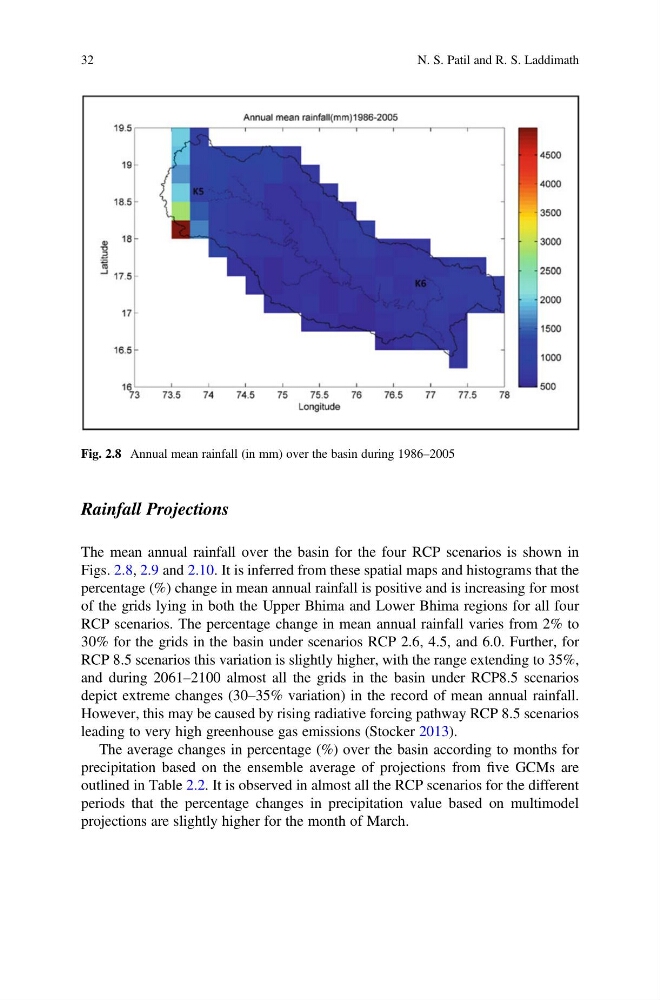
The mean annual rainfall over the basin for the four RCP scenarios is shown in
Figs. 2.8, 2.9 and 2.10. It is inferred from these spatial maps and histograms that the
percentage (%) change in mean annual rainfall is positive and is increasing for most
of the grids lying in both the Upper Bhima and Lower Bhima regions for all four
RCP scenarios. The percentage change in mean annual rainfall varies from 2% to
30% for the grids in the basin under scenarios RCP 2.6, 4.5, and 6.0. Further, for
RCP 8.5 scenarios this variation is slightly higher, with the range extending to 35%,
and during 2061–2100 almost all the grids in the basin under RCP8.5 scenarios
depict extreme changes (30–35% variation) in the record of mean annual rainfall.
However, this may be caused by rising radiative forcing pathway RCP 8.5 scenarios
leading to very high greenhouse gas emissions (Stocker 2013).
The average changes in percentage (%) over the basin according to months for
precipitation based on the ensemble average of projections from five GCMs are
outlined in Table 2.2. It is observed in almost all the RCP scenarios for the different
periods that the percentage changes in precipitation value based on multimodel
projections are slightly higher for the month of March.
Fig. 2.8 Annual mean rainfall (in mm) over the basin during 1986–2005
32
N. S. Patil and R. S. Laddimath
The mean annual rainfall over the basin for the four RCP scenarios is shown in
Figs. 2.8, 2.9 and 2.10. It is inferred from these spatial maps and histograms that the
percentage (%) change in mean annual rainfall is positive and is increasing for most
of the grids lying in both the Upper Bhima and Lower Bhima regions for all four
RCP scenarios. The percentage change in mean annual rainfall varies from 2% to
30% for the grids in the basin under scenarios RCP 2.6, 4.5, and 6.0. Further, for
RCP 8.5 scenarios this variation is slightly higher, with the range extending to 35%,
and during 2061–2100 almost all the grids in the basin under RCP8.5 scenarios
depict extreme changes (30–35% variation) in the record of mean annual rainfall.
However, this may be caused by rising radiative forcing pathway RCP 8.5 scenarios
leading to very high greenhouse gas emissions (Stocker 2013).
The average changes in percentage (%) over the basin according to months for
precipitation based on the ensemble average of projections from five GCMs are
outlined in Table 2.2. It is observed in almost all the RCP scenarios for the different
periods that the percentage changes in precipitation value based on multimodel
projections are slightly higher for the month of March.
Fig. 2.8 Annual mean rainfall (in mm) over the basin during 1986–2005
32
N. S. Patil and R. S. Laddimath