

Monthly Variations
The mean monthly rainfall over the Sahibi Basin during 1957–2017 is shown in
Fig. 12.8. This figure shows wide spatial variations in the amount of rainfall during
different months over the Sahibi Basin. During January, February, and March, the
amount of rainfall is much less over the entire basin. Only the northwestern parts
received slightly higher rainfall, whereas the northeastern and southern parts
received the lowest rainfall in these 3 months. In April, the amount of rainfall is
relatively less, as in the earlier 3 months; however, the pattern of rainfall changed
slightly and the southeastern parts have also witnessed an increase in rainfall. In the
months of May and June, a sharp increase in rainfall was observed over the entire
basin, especially over the southern areas. Then, maximum rainfall amounts have
been witnessed over the entire basin during July and August because of the moistureladen monsoonal winds. After the month of September, rainfall decreased rapidly,
and the least amount of rainfall was received in November over the entire basin. On
the other hand, the CV values have shown an opposite pattern to the mean monthly
rainfall (Fig. 12.9). The northeastern parts of the basin experienced high variability
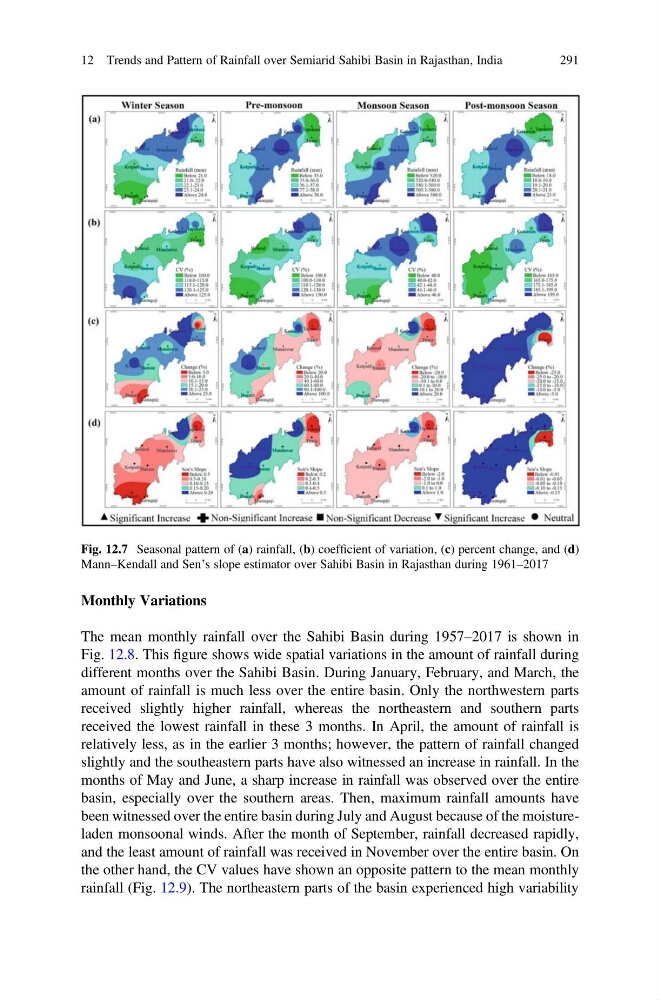
Fig. 12.7 Seasonal pattern of (a) rainfall, (b) coefficient of variation, (c) percent change, and (d)
Mann–Kendall and Sen’s slope estimator over Sahibi Basin in Rajasthan during 1961–2017
12 Trends and Pattern of Rainfall over Semiarid Sahibi Basin in Rajasthan, India
291
The mean monthly rainfall over the Sahibi Basin during 1957–2017 is shown in
Fig. 12.8. This figure shows wide spatial variations in the amount of rainfall during
different months over the Sahibi Basin. During January, February, and March, the
amount of rainfall is much less over the entire basin. Only the northwestern parts
received slightly higher rainfall, whereas the northeastern and southern parts
received the lowest rainfall in these 3 months. In April, the amount of rainfall is
relatively less, as in the earlier 3 months; however, the pattern of rainfall changed
slightly and the southeastern parts have also witnessed an increase in rainfall. In the
months of May and June, a sharp increase in rainfall was observed over the entire
basin, especially over the southern areas. Then, maximum rainfall amounts have
been witnessed over the entire basin during July and August because of the moistureladen monsoonal winds. After the month of September, rainfall decreased rapidly,
and the least amount of rainfall was received in November over the entire basin. On
the other hand, the CV values have shown an opposite pattern to the mean monthly
rainfall (Fig. 12.9). The northeastern parts of the basin experienced high variability
Fig. 12.7 Seasonal pattern of (a) rainfall, (b) coefficient of variation, (c) percent change, and (d)
Mann–Kendall and Sen’s slope estimator over Sahibi Basin in Rajasthan during 1961–2017
12 Trends and Pattern of Rainfall over Semiarid Sahibi Basin in Rajasthan, India
291