

parts of the Sahibi Basin (Fig. 12.7a; Table 12.6). Only the northern and northwestern parts observed slightly higher amounts of rainfall than other parts, which may be
attributed to rainfall associated with western disturbances. During the pre-monsoon
season, rainfall increased slightly (between 29 and 41 mm) over the entire basin,
especially over the southeastern parts. After that, a sharp increase in rainfall
(between 506 and 624 mm) was witnessed over the entire basin during monsoon
season. During the post-monsoon season, the entire basin received the least rainfall
(between 18 and 23 mm). The northeastern part received the least rainfall in all the
seasons. Apart from this, the CV has shown an opposite pattern to the mean rainfall
in each season (Fig. 12.7b). The lowest CV values have been witnessed in the
monsoon season, followed by post-monsoon, winter, and pre-monsoon, over the
entire Sahibi Basin (Table 12.6).
Further, the entire basin has witnessed a positive percent change in mean rainfall,
as all the stations observed a rising trend during winter and pre-monsoon seasons
over the Sahibi Basin (Fig. 12.7c–d). However, a negative change has been observed
during the monsoon season over large parts of the basin. During the post-monsoon
season, no significant positive or negative percent change in rainfall has been
observed.
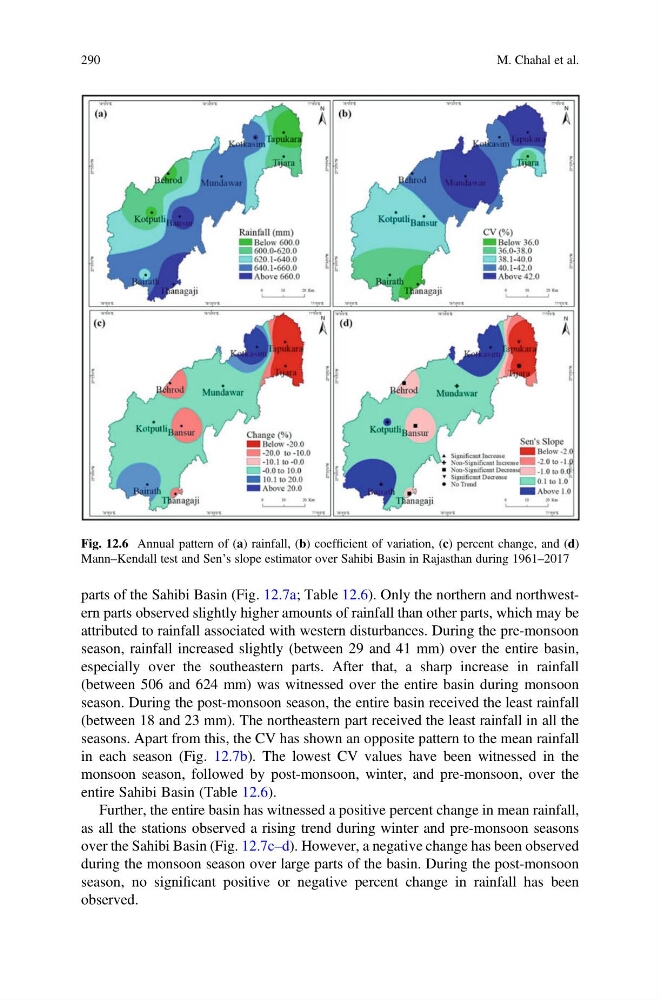
Fig. 12.6 Annual pattern of (a) rainfall, (b) coefficient of variation, (c) percent change, and (d)
Mann–Kendall test and Sen’s slope estimator over Sahibi Basin in Rajasthan during 1961–2017
290
M. Chahal et al.
attributed to rainfall associated with western disturbances. During the pre-monsoon
season, rainfall increased slightly (between 29 and 41 mm) over the entire basin,
especially over the southeastern parts. After that, a sharp increase in rainfall
(between 506 and 624 mm) was witnessed over the entire basin during monsoon
season. During the post-monsoon season, the entire basin received the least rainfall
(between 18 and 23 mm). The northeastern part received the least rainfall in all the
seasons. Apart from this, the CV has shown an opposite pattern to the mean rainfall
in each season (Fig. 12.7b). The lowest CV values have been witnessed in the
monsoon season, followed by post-monsoon, winter, and pre-monsoon, over the
entire Sahibi Basin (Table 12.6).
Further, the entire basin has witnessed a positive percent change in mean rainfall,
as all the stations observed a rising trend during winter and pre-monsoon seasons
over the Sahibi Basin (Fig. 12.7c–d). However, a negative change has been observed
during the monsoon season over large parts of the basin. During the post-monsoon
season, no significant positive or negative percent change in rainfall has been
observed.
Fig. 12.6 Annual pattern of (a) rainfall, (b) coefficient of variation, (c) percent change, and (d)
Mann–Kendall test and Sen’s slope estimator over Sahibi Basin in Rajasthan during 1961–2017
290
M. Chahal et al.