

is calculated at 29 GW; only about 7% of that was developed because of high
resource impact and potential drilling costs (World Bank 2018). Geothermal potential supplies about 5% of the nation’s electricity demand (ESDM 2018b). Many of
the issues faced by the geothermal sector in Indonesia are common, such as
commercial threats from large project timeframes, exploration and resource risks,
and generally high production costs (Bloomberg NEF (BNEF) and Business Council
for Sustainable Energy 2018). Thanks to these industry-based obstacles, several
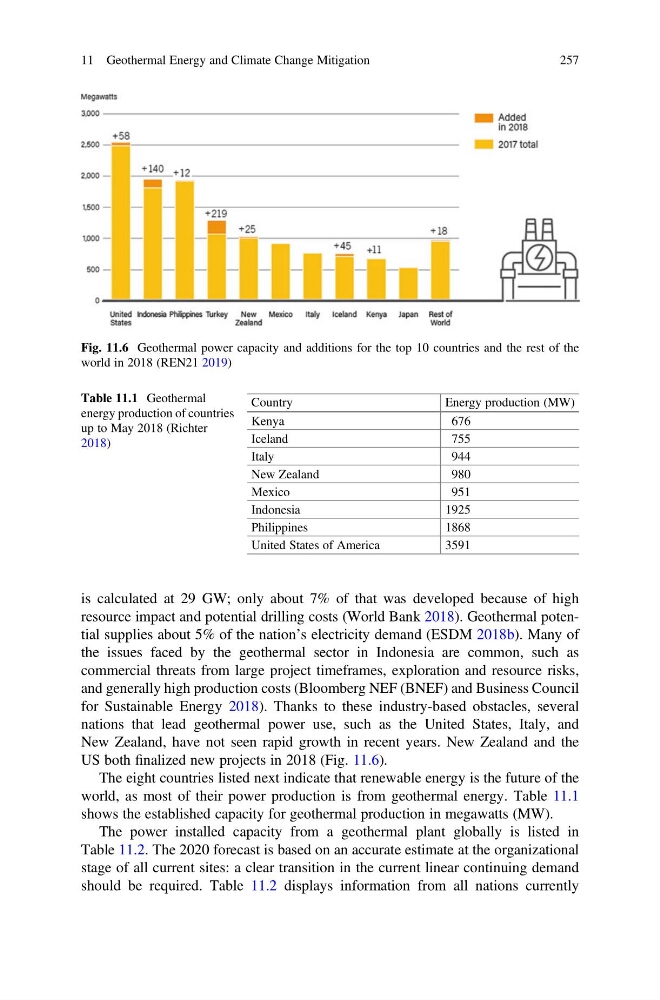
nations that lead geothermal power use, such as the United States, Italy, and
New Zealand, have not seen rapid growth in recent years. New Zealand and the
US both finalized new projects in 2018 (Fig. 11.6).
The eight countries listed next indicate that renewable energy is the future of the
world, as most of their power production is from geothermal energy. Table 11.1
shows the established capacity for geothermal production in megawatts (MW).
The power installed capacity from a geothermal plant globally is listed in
Table 11.2. The 2020 forecast is based on an accurate estimate at the organizational
stage of all current sites: a clear transition in the current linear continuing demand
should be required. Table 11.2 displays information from all nations currently
Fig. 11.6 Geothermal power capacity and additions for the top 10 countries and the rest of the
world in 2018 (REN21 2019)
Table 11.1 Geothermal
energy production of countries
up to May 2018 (Richter
2018)
Country
Energy production (MW)
Kenya
676
Iceland
755
Italy
944
New Zealand
980
Mexico
951
Indonesia
1925
Philippines
1868
United States of America
3591
11 Geothermal Energy and Climate Change Mitigation
257
resource impact and potential drilling costs (World Bank 2018). Geothermal potential supplies about 5% of the nation’s electricity demand (ESDM 2018b). Many of
the issues faced by the geothermal sector in Indonesia are common, such as
commercial threats from large project timeframes, exploration and resource risks,
and generally high production costs (Bloomberg NEF (BNEF) and Business Council
for Sustainable Energy 2018). Thanks to these industry-based obstacles, several
nations that lead geothermal power use, such as the United States, Italy, and
New Zealand, have not seen rapid growth in recent years. New Zealand and the
US both finalized new projects in 2018 (Fig. 11.6).
The eight countries listed next indicate that renewable energy is the future of the
world, as most of their power production is from geothermal energy. Table 11.1
shows the established capacity for geothermal production in megawatts (MW).
The power installed capacity from a geothermal plant globally is listed in
Table 11.2. The 2020 forecast is based on an accurate estimate at the organizational
stage of all current sites: a clear transition in the current linear continuing demand
should be required. Table 11.2 displays information from all nations currently
Fig. 11.6 Geothermal power capacity and additions for the top 10 countries and the rest of the
world in 2018 (REN21 2019)
Table 11.1 Geothermal
energy production of countries
up to May 2018 (Richter
2018)
Country
Energy production (MW)
Kenya
676
Iceland
755
Italy
944
New Zealand
980
Mexico
951
Indonesia
1925
Philippines
1868
United States of America
3591
11 Geothermal Energy and Climate Change Mitigation
257