

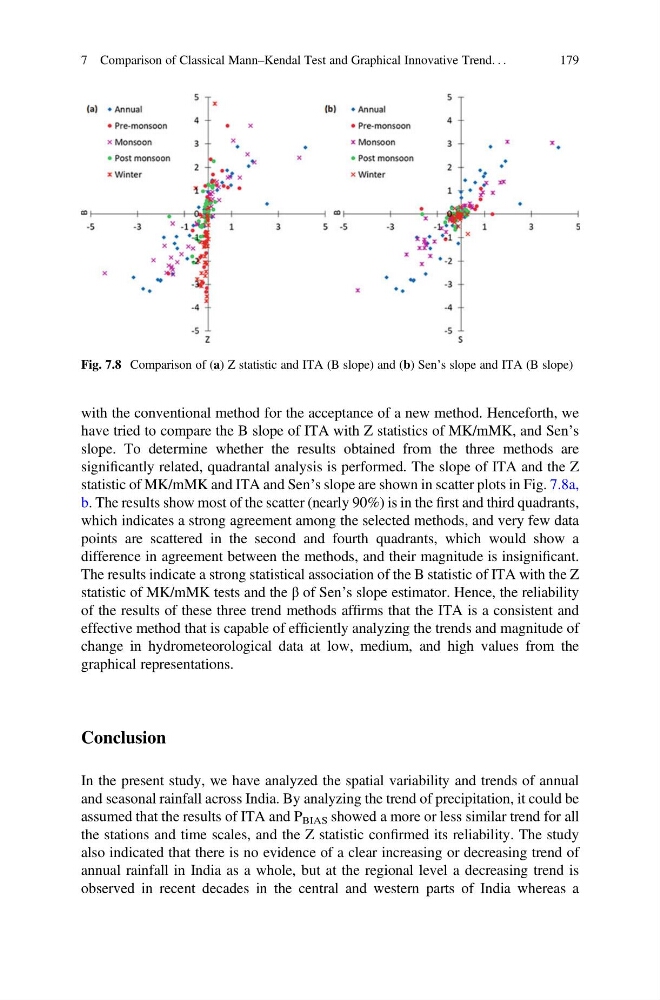
with the conventional method for the acceptance of a new method. Henceforth, we
have tried to compare the B slope of ITA with Z statistics of MK/mMK, and Sen’s
slope. To determine whether the results obtained from the three methods are
significantly related, quadrantal analysis is performed. The slope of ITA and the Z
statistic of MK/mMK and ITA and Sen’s slope are shown in scatter plots in Fig. 7.8a,
b. The results show most of the scatter (nearly 90%) is in the first and third quadrants,
which indicates a strong agreement among the selected methods, and very few data
points are scattered in the second and fourth quadrants, which would show a
difference in agreement between the methods, and their magnitude is insignificant.
The results indicate a strong statistical association of the B statistic of ITA with the Z
statistic of MK/mMK tests and the β of Sen’s slope estimator. Hence, the reliability
of the results of these three trend methods affirms that the ITA is a consistent and
effective method that is capable of efficiently analyzing the trends and magnitude of
change in hydrometeorological data at low, medium, and high values from the
graphical representations.
Conclusion
In the present study, we have analyzed the spatial variability and trends of annual
and seasonal rainfall across India. By analyzing the trend of precipitation, it could be
assumed that the results of ITA and P BIAS showed a more or less similar trend for all
the stations and time scales, and the Z statistic confirmed its reliability. The study
also indicated that there is no evidence of a clear increasing or decreasing trend of
annual rainfall in India as a whole, but at the regional level a decreasing trend is
observed in recent decades in the central and western parts of India whereas a
Fig. 7.8 Comparison of (a) Z statistic and ITA (B slope) and (b) Sen’s slope and ITA (B slope)
7 Comparison of Classical Mann–Kendal Test and Graphical Innovative Trend. . .
179
have tried to compare the B slope of ITA with Z statistics of MK/mMK, and Sen’s
slope. To determine whether the results obtained from the three methods are
significantly related, quadrantal analysis is performed. The slope of ITA and the Z
statistic of MK/mMK and ITA and Sen’s slope are shown in scatter plots in Fig. 7.8a,
b. The results show most of the scatter (nearly 90%) is in the first and third quadrants,
which indicates a strong agreement among the selected methods, and very few data
points are scattered in the second and fourth quadrants, which would show a
difference in agreement between the methods, and their magnitude is insignificant.
The results indicate a strong statistical association of the B statistic of ITA with the Z
statistic of MK/mMK tests and the β of Sen’s slope estimator. Hence, the reliability
of the results of these three trend methods affirms that the ITA is a consistent and
effective method that is capable of efficiently analyzing the trends and magnitude of
change in hydrometeorological data at low, medium, and high values from the
graphical representations.
Conclusion
In the present study, we have analyzed the spatial variability and trends of annual
and seasonal rainfall across India. By analyzing the trend of precipitation, it could be
assumed that the results of ITA and P BIAS showed a more or less similar trend for all
the stations and time scales, and the Z statistic confirmed its reliability. The study
also indicated that there is no evidence of a clear increasing or decreasing trend of
annual rainfall in India as a whole, but at the regional level a decreasing trend is
observed in recent decades in the central and western parts of India whereas a
Fig. 7.8 Comparison of (a) Z statistic and ITA (B slope) and (b) Sen’s slope and ITA (B slope)
7 Comparison of Classical Mann–Kendal Test and Graphical Innovative Trend. . .
179