

between 0.01 and 0.29 mm/year, which is very marginal (Fig. 7.6a). However, the
highest increasing trend (slope ¼ +0.29 mm/year) obtained from ITA is observed at
Rayalseema of Andhra Pradesh and the lowest is observed in Arunachal Pradesh
(slope ¼ À1.65). On the other hand, a few of the subdivisions (8.33%) for postmonsoon showed a significant trend (Z statistics) at different levels of significance
levels; among these, nearly 6% exhibited a significant decreasing trend (Table 7.5).
Sen’s slope estimation revealed that the average rainfall decreases at a rate of
0.20 mm/year for the post-monsoon season. However, the highest decreasing and
increasing trends are observed at Lakshadweep (0.66 mm/year) and Coastal Karnataka (0.29 mm/year), respectively. Moreover, the high moderate correlations
between the slope of ITA and Sen’s slope (r ¼ 0.542) and high correlation between
slope of ITA and Z of MK/mMK (r ¼ 0.842) methods confirmed the reliability of the
ITA method. Percentage bias showed that most of the region received less rainfall in
the second half (1959–2015). On the other hand, Arunachal Pradesh, Uttarakhand,
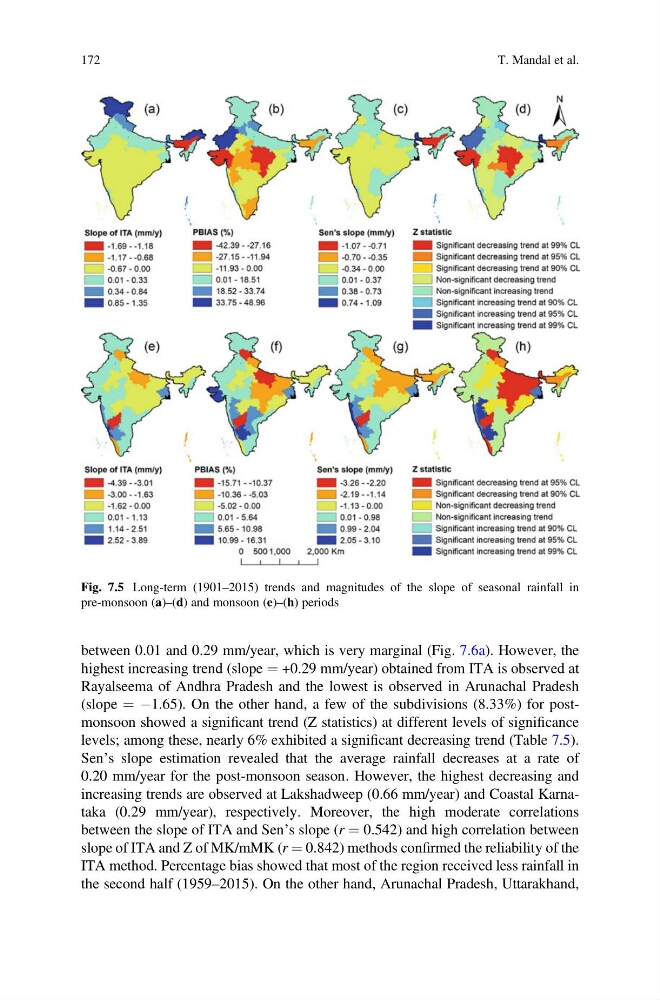
Fig. 7.5 Long-term (1901–2015) trends and magnitudes of the slope of seasonal rainfall in
pre-monsoon (a)–(d) and monsoon (e)–(h) periods
172
T. Mandal et al.
highest increasing trend (slope ¼ +0.29 mm/year) obtained from ITA is observed at
Rayalseema of Andhra Pradesh and the lowest is observed in Arunachal Pradesh
(slope ¼ À1.65). On the other hand, a few of the subdivisions (8.33%) for postmonsoon showed a significant trend (Z statistics) at different levels of significance
levels; among these, nearly 6% exhibited a significant decreasing trend (Table 7.5).
Sen’s slope estimation revealed that the average rainfall decreases at a rate of
0.20 mm/year for the post-monsoon season. However, the highest decreasing and
increasing trends are observed at Lakshadweep (0.66 mm/year) and Coastal Karnataka (0.29 mm/year), respectively. Moreover, the high moderate correlations
between the slope of ITA and Sen’s slope (r ¼ 0.542) and high correlation between
slope of ITA and Z of MK/mMK (r ¼ 0.842) methods confirmed the reliability of the
ITA method. Percentage bias showed that most of the region received less rainfall in
the second half (1959–2015). On the other hand, Arunachal Pradesh, Uttarakhand,
Fig. 7.5 Long-term (1901–2015) trends and magnitudes of the slope of seasonal rainfall in
pre-monsoon (a)–(d) and monsoon (e)–(h) periods
172
T. Mandal et al.