

Monsoon Rainfall
The results of the ITA slope of monsoon rainfall have documented the dominance of
both increasing and decreasing trends during the study period. Half the meteorological subdivisions (50%) registered a negative trend, and in the rest of the subdivisions a positive trend is observed in this season. Wherein, about 42 % are statistically
significant for increasing and decreasing trends at 95% confidence interval (Fig. 7.7).
The results of ITA also revealed that remarkable positive trends are observed in
Coastal Karnataka (slope ¼ +3.89), Konkan & Goa (slope ¼ +1.98), and South
Interior Karnataka (slope ¼ +1.81), whereas notable decreasing trends are observed
in Arunachal Pradesh (slope ¼ À18.51), Naga Mani Mizo Tripura (slope ¼ À4.39),
and Himachal Pradesh (slope ¼ À2.32), respectively (Table 7.4 and Fig. 7.5). The
results obtained from the Z statistic test and Sen’s slope estimator specify nearly
similar results for increasing and decreasing trends with 0.01, 0.05, and 0.1 levels of
significance. However, the maximum increasing (3.10 mm/year) and decreasing rate
(À3.26 mm/year) obtained from Sen’s slope are found in Konkan & Goa and Naga,
Mani, Mizo, and Tripura, respectively (Table 7.4). Percentage bias of monsoon
rainfall shows that in South Interior Karnataka (16%), the rainfed region of India
has gained the highest increase in rainfall in the second half (1959–2015) in
comparison to the first half (1901–1958). This increasing trend may amplify the
vulnerability of landslides and flash flood in mountain regions and riverbank erosion
in coastal areas of India (Mandal et al. 2020). Similarly, Himachal Pradesh (15.71%)
experienced the greatest decrease in rainfall in the second half (1959–2015) in
comparison to the first half (1901–1958) of the study period.
Post-Monsoon Rainfall
The results of ITA, P BIAS, MK/mMK, and Sen’s slope of post-monsoon rainfall are
presented in Table 7.5 and Fig. 7.6. In this period, most of the subdivisions
(69.44%,) showed decreasing trends (ITA) over the entire Gangetic basin, central
India, and the western part of Deccan plateau (Fig. 7.6a), however, about 55 % of
them are statistically significant at 0.05 significance level. On the other hand approximately one third (27%) of the subdivision showed significant positive trends in the
study period. The degree of the increasing trend for the major part of the area varied
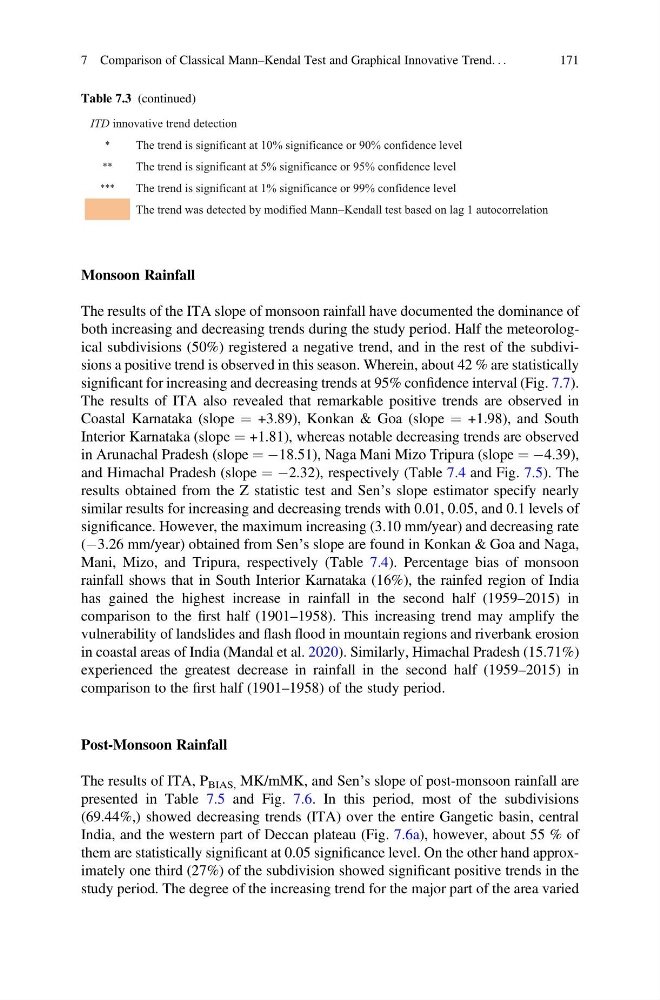
Table 7.3 (continued)
ITD innovative trend detection
*
The trend is significant at 10% significance or 90% confidence level
**
The trend is significant at 5% significance or 95% confidence level
***
The trend is significant at 1% significance or 99% confidence level
The trend was detected by modified Mann-Kendall test based on lag 1 autocorrelation
7 Comparison of Classical Mann–Kendal Test and Graphical Innovative Trend. . .
171
The results of the ITA slope of monsoon rainfall have documented the dominance of
both increasing and decreasing trends during the study period. Half the meteorological subdivisions (50%) registered a negative trend, and in the rest of the subdivisions a positive trend is observed in this season. Wherein, about 42 % are statistically
significant for increasing and decreasing trends at 95% confidence interval (Fig. 7.7).
The results of ITA also revealed that remarkable positive trends are observed in
Coastal Karnataka (slope ¼ +3.89), Konkan & Goa (slope ¼ +1.98), and South
Interior Karnataka (slope ¼ +1.81), whereas notable decreasing trends are observed
in Arunachal Pradesh (slope ¼ À18.51), Naga Mani Mizo Tripura (slope ¼ À4.39),
and Himachal Pradesh (slope ¼ À2.32), respectively (Table 7.4 and Fig. 7.5). The
results obtained from the Z statistic test and Sen’s slope estimator specify nearly
similar results for increasing and decreasing trends with 0.01, 0.05, and 0.1 levels of
significance. However, the maximum increasing (3.10 mm/year) and decreasing rate
(À3.26 mm/year) obtained from Sen’s slope are found in Konkan & Goa and Naga,
Mani, Mizo, and Tripura, respectively (Table 7.4). Percentage bias of monsoon
rainfall shows that in South Interior Karnataka (16%), the rainfed region of India
has gained the highest increase in rainfall in the second half (1959–2015) in
comparison to the first half (1901–1958). This increasing trend may amplify the
vulnerability of landslides and flash flood in mountain regions and riverbank erosion
in coastal areas of India (Mandal et al. 2020). Similarly, Himachal Pradesh (15.71%)
experienced the greatest decrease in rainfall in the second half (1959–2015) in
comparison to the first half (1901–1958) of the study period.
Post-Monsoon Rainfall
The results of ITA, P BIAS, MK/mMK, and Sen’s slope of post-monsoon rainfall are
presented in Table 7.5 and Fig. 7.6. In this period, most of the subdivisions
(69.44%,) showed decreasing trends (ITA) over the entire Gangetic basin, central
India, and the western part of Deccan plateau (Fig. 7.6a), however, about 55 % of
them are statistically significant at 0.05 significance level. On the other hand approximately one third (27%) of the subdivision showed significant positive trends in the
study period. The degree of the increasing trend for the major part of the area varied
Table 7.3 (continued)
ITD innovative trend detection
*
The trend is significant at 10% significance or 90% confidence level
**
The trend is significant at 5% significance or 95% confidence level
***
The trend is significant at 1% significance or 99% confidence level
The trend was detected by modified Mann-Kendall test based on lag 1 autocorrelation
7 Comparison of Classical Mann–Kendal Test and Graphical Innovative Trend. . .
171