

Meghalaya, respectively (Table 7.3). The percent bias (P BIAS ) showed similar results
with ITA with a little discrepancy in spatial distribution, whereas West Rajasthan
showed maximum positive (+48.96%) change and the Gujarat region showed a
maximum negative (À42.39%) change in the second half (1959–2015) of the
study period. The trends in pre-monsoon rainfall in this season obtained by the
three methods are moderately correlated, and the slope of ITA and Sen’s slope
(r ¼ 0.849) is quite highly correlated compared to the slope of ITA and Z of
MK/mMK (r ¼ 0.624).
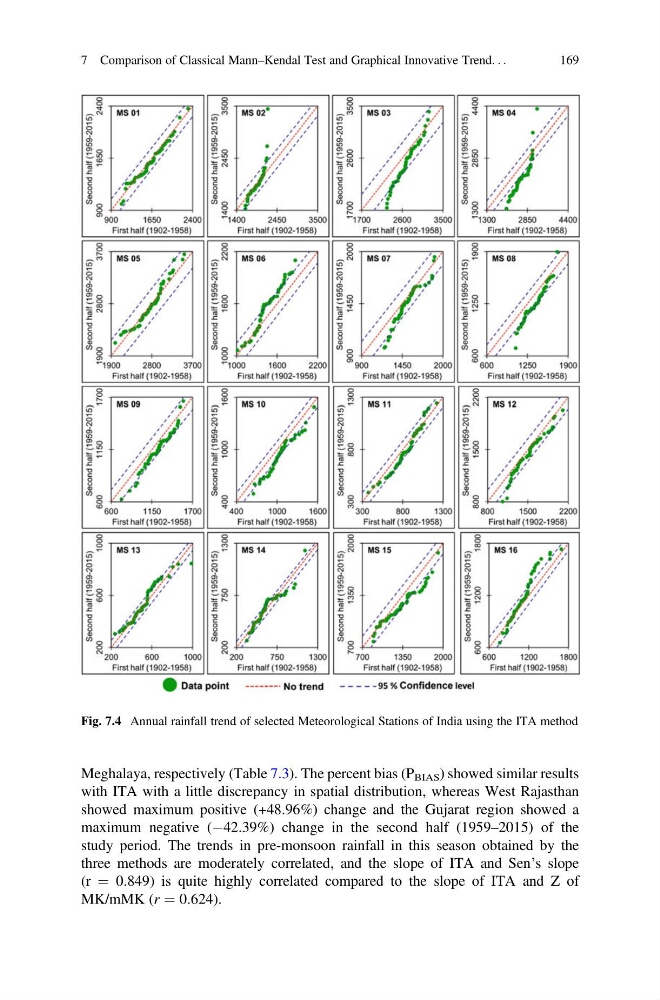
Fig. 7.4 Annual rainfall trend of selected Meteorological Stations of India using the ITA method
7 Comparison of Classical Mann–Kendal Test and Graphical Innovative Trend. . .
169
with ITA with a little discrepancy in spatial distribution, whereas West Rajasthan
showed maximum positive (+48.96%) change and the Gujarat region showed a
maximum negative (À42.39%) change in the second half (1959–2015) of the
study period. The trends in pre-monsoon rainfall in this season obtained by the
three methods are moderately correlated, and the slope of ITA and Sen’s slope
(r ¼ 0.849) is quite highly correlated compared to the slope of ITA and Z of
MK/mMK (r ¼ 0.624).
Fig. 7.4 Annual rainfall trend of selected Meteorological Stations of India using the ITA method
7 Comparison of Classical Mann–Kendal Test and Graphical Innovative Trend. . .
169