

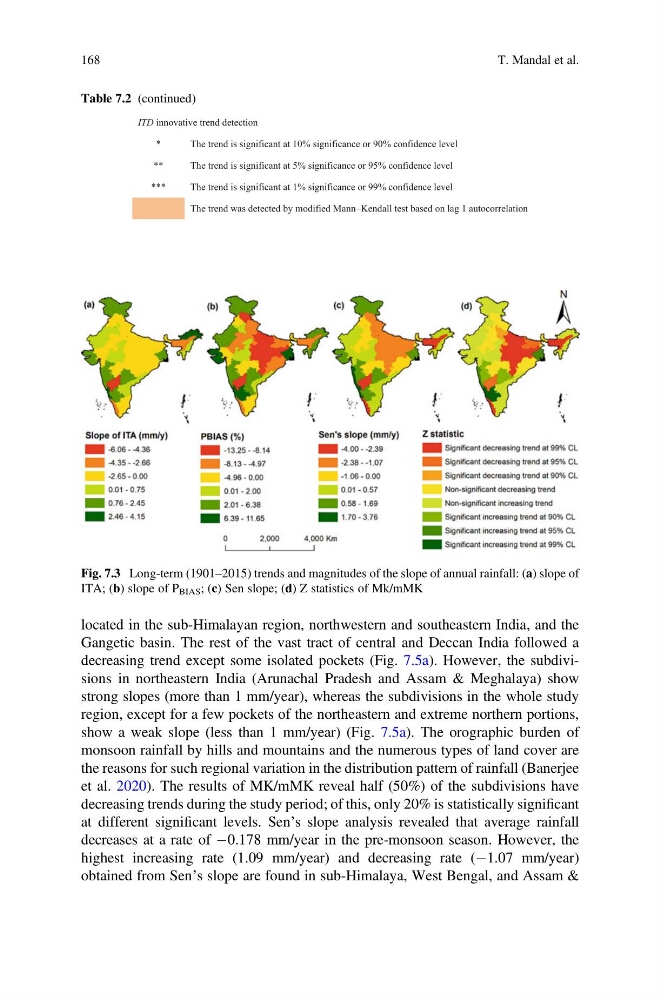
located in the sub-Himalayan region, northwestern and southeastern India, and the
Gangetic basin. The rest of the vast tract of central and Deccan India followed a
decreasing trend except some isolated pockets (Fig. 7.5a). However, the subdivisions in northeastern India (Arunachal Pradesh and Assam & Meghalaya) show
strong slopes (more than 1 mm/year), whereas the subdivisions in the whole study
region, except for a few pockets of the northeastern and extreme northern portions,
show a weak slope (less than 1 mm/year) (Fig. 7.5a). The orographic burden of
monsoon rainfall by hills and mountains and the numerous types of land cover are
the reasons for such regional variation in the distribution pattern of rainfall (Banerjee
et al. 2020). The results of MK/mMK reveal half (50%) of the subdivisions have
decreasing trends during the study period; of this, only 20% is statistically significant
at different significant levels. Sen’s slope analysis revealed that average rainfall
decreases at a rate of À0.178 mm/year in the pre-monsoon season. However, the
highest increasing rate (1.09 mm/year) and decreasing rate (À1.07 mm/year)
obtained from Sen’s slope are found in sub-Himalaya, West Bengal, and Assam &
Table 7.2 (continued)
ITD innovative trend detection
*
The trend is significant at 10% significance or 90% confidence level
**
The trend is significant at 5% significance or 95% confidence level
***
The trend is significant at 1% significance or 99% confidence level
The trend was detected by modified Mann-Kendall test based on lag 1 autocorrelation
Fig. 7.3 Long-term (1901–2015) trends and magnitudes of the slope of annual rainfall: (a) slope of
ITA; (b) slope of P BIAS ; (c) Sen slope; (d) Z statistics of Mk/mMK
168
T. Mandal et al.
Gangetic basin. The rest of the vast tract of central and Deccan India followed a
decreasing trend except some isolated pockets (Fig. 7.5a). However, the subdivisions in northeastern India (Arunachal Pradesh and Assam & Meghalaya) show
strong slopes (more than 1 mm/year), whereas the subdivisions in the whole study
region, except for a few pockets of the northeastern and extreme northern portions,
show a weak slope (less than 1 mm/year) (Fig. 7.5a). The orographic burden of
monsoon rainfall by hills and mountains and the numerous types of land cover are
the reasons for such regional variation in the distribution pattern of rainfall (Banerjee
et al. 2020). The results of MK/mMK reveal half (50%) of the subdivisions have
decreasing trends during the study period; of this, only 20% is statistically significant
at different significant levels. Sen’s slope analysis revealed that average rainfall
decreases at a rate of À0.178 mm/year in the pre-monsoon season. However, the
highest increasing rate (1.09 mm/year) and decreasing rate (À1.07 mm/year)
obtained from Sen’s slope are found in sub-Himalaya, West Bengal, and Assam &
Table 7.2 (continued)
ITD innovative trend detection
*
The trend is significant at 10% significance or 90% confidence level
**
The trend is significant at 5% significance or 95% confidence level
***
The trend is significant at 1% significance or 99% confidence level
The trend was detected by modified Mann-Kendall test based on lag 1 autocorrelation
Fig. 7.3 Long-term (1901–2015) trends and magnitudes of the slope of annual rainfall: (a) slope of
ITA; (b) slope of P BIAS ; (c) Sen slope; (d) Z statistics of Mk/mMK
168
T. Mandal et al.