

5.4 Results and Discussion
169
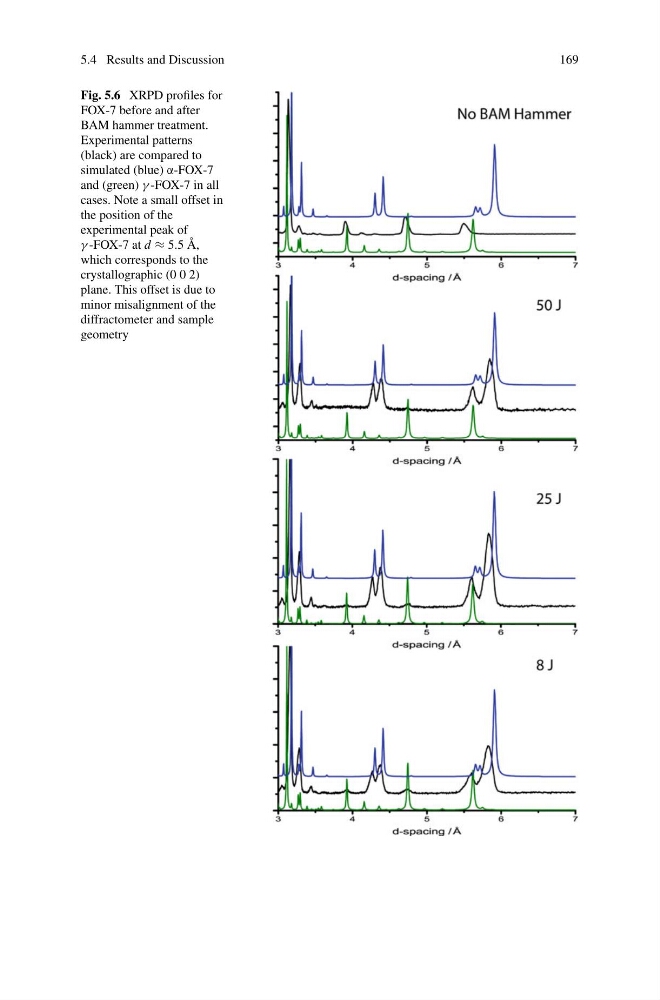
Fig. 5.6 XRPD profiles for
FOX-7 before and after
BAM hammer treatment.
Experimental patterns
(black) are compared to
simulated (blue) α-FOX-7
and (green) γ -FOX-7 in all
cases. Note a small offset in
the position of the
experimental peak of
γ -FOX-7 at d ≈ 5.5 Å,
which corresponds to the
crystallographic (0 0 2)
plane. This offset is due to
minor misalignment of the
diffractometer and sample
geometry
169
Fig. 5.6 XRPD profiles for
FOX-7 before and after
BAM hammer treatment.
Experimental patterns
(black) are compared to
simulated (blue) α-FOX-7
and (green) γ -FOX-7 in all
cases. Note a small offset in
the position of the
experimental peak of
γ -FOX-7 at d ≈ 5.5 Å,
which corresponds to the
crystallographic (0 0 2)
plane. This offset is due to
minor misalignment of the
diffractometer and sample
geometry