

104
3 Vibrational Up-Pumping: Predicting Impact Sensitivity of Some …
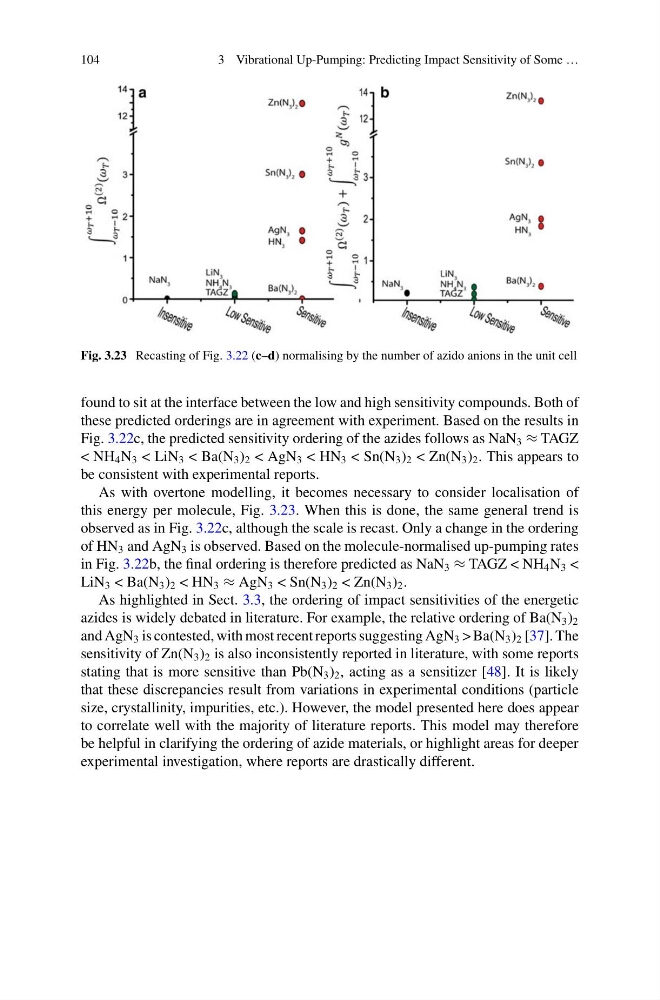
Fig. 3.23 Recasting of Fig. 3.22 (c–d) normalising by the number of azido anions in the unit cell
found to sit at the interface between the low and high sensitivity compounds. Both of
these predicted orderings are in agreement with experiment. Based on the results in
Fig. 3.22c, the predicted sensitivity ordering of the azides follows as NaN 3 ≈ TAGZ
< NH 4 N 3 < LiN 3 < Ba(N 3 ) 2 < AgN 3 < HN 3 < Sn(N 3 ) 2 < Zn(N 3 ) 2 . This appears to
be consistent with experimental reports.
As with overtone modelling, it becomes necessary to consider localisation of
this energy per molecule, Fig. 3.23. When this is done, the same general trend is
observed as in Fig. 3.22c, although the scale is recast. Only a change in the ordering
of HN 3 and AgN 3 is observed. Based on the molecule-normalised up-pumping rates
in Fig. 3.22b, the final ordering is therefore predicted as NaN 3 ≈ TAGZ < NH 4 N 3 <
LiN 3 < Ba(N 3 ) 2 < HN 3 ≈ AgN 3 < Sn(N 3 ) 2 < Zn(N 3 ) 2 .
As highlighted in Sect. 3.3, the ordering of impact sensitivities of the energetic
azides is widely debated in literature. For example, the relative ordering of Ba(N 3 ) 2
and AgN 3 is contested, with most recent reports suggesting AgN 3 > Ba(N 3 ) 2 [37]. The
sensitivity of Zn(N 3 ) 2 is also inconsistently reported in literature, with some reports
stating that is more sensitive than Pb(N 3 ) 2 , acting as a sensitizer [48]. It is likely
that these discrepancies result from variations in experimental conditions (particle
size, crystallinity, impurities, etc.). However, the model presented here does appear
to correlate well with the majority of literature reports. This model may therefore
be helpful in clarifying the ordering of azide materials, or highlight areas for deeper
experimental investigation, where reports are drastically different.
3 Vibrational Up-Pumping: Predicting Impact Sensitivity of Some …
Fig. 3.23 Recasting of Fig. 3.22 (c–d) normalising by the number of azido anions in the unit cell
found to sit at the interface between the low and high sensitivity compounds. Both of
these predicted orderings are in agreement with experiment. Based on the results in
Fig. 3.22c, the predicted sensitivity ordering of the azides follows as NaN 3 ≈ TAGZ
< NH 4 N 3 < LiN 3 < Ba(N 3 ) 2 < AgN 3 < HN 3 < Sn(N 3 ) 2 < Zn(N 3 ) 2 . This appears to
be consistent with experimental reports.
As with overtone modelling, it becomes necessary to consider localisation of
this energy per molecule, Fig. 3.23. When this is done, the same general trend is
observed as in Fig. 3.22c, although the scale is recast. Only a change in the ordering
of HN 3 and AgN 3 is observed. Based on the molecule-normalised up-pumping rates
in Fig. 3.22b, the final ordering is therefore predicted as NaN 3 ≈ TAGZ < NH 4 N 3 <
LiN 3 < Ba(N 3 ) 2 < HN 3 ≈ AgN 3 < Sn(N 3 ) 2 < Zn(N 3 ) 2 .
As highlighted in Sect. 3.3, the ordering of impact sensitivities of the energetic
azides is widely debated in literature. For example, the relative ordering of Ba(N 3 ) 2
and AgN 3 is contested, with most recent reports suggesting AgN 3 > Ba(N 3 ) 2 [37]. The
sensitivity of Zn(N 3 ) 2 is also inconsistently reported in literature, with some reports
stating that is more sensitive than Pb(N 3 ) 2 , acting as a sensitizer [48]. It is likely
that these discrepancies result from variations in experimental conditions (particle
size, crystallinity, impurities, etc.). However, the model presented here does appear
to correlate well with the majority of literature reports. This model may therefore
be helpful in clarifying the ordering of azide materials, or highlight areas for deeper
experimental investigation, where reports are drastically different.