

3.5 Results and Discussion
85
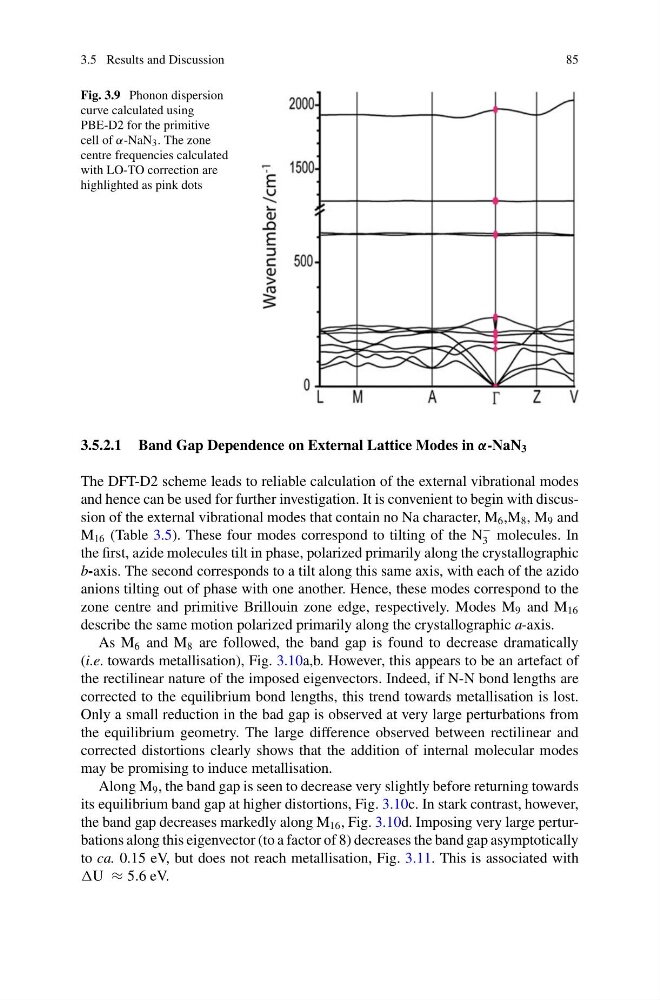
Fig. 3.9 Phonon dispersion
curve calculated using
PBE-D2 for the primitive
cell of α-NaN 3 . The zone
centre frequencies calculated
with LO-TO correction are
highlighted as pink dots
3.5.2.1 Band Gap Dependence on External Lattice Modes in α-NaN 3
The DFT-D2 scheme leads to reliable calculation of the external vibrational modes
and hence can be used for further investigation. It is convenient to begin with discussion of the external vibrational modes that contain no Na character, M 6 ,M 8 , M 9 and
M 16 (Table 3.5). These four modes correspond to tilting of the N
−
3 molecules. In
the first, azide molecules tilt in phase, polarized primarily along the crystallographic
b-axis. The second corresponds to a tilt along this same axis, with each of the azido
anions tilting out of phase with one another. Hence, these modes correspond to the
zone centre and primitive Brillouin zone edge, respectively. Modes M 9 and M 16
describe the same motion polarized primarily along the crystallographic a-axis.
As M 6 and M 8 are followed, the band gap is found to decrease dramatically
(i.e. towards metallisation), Fig. 3.10a,b. However, this appears to be an artefact of
the rectilinear nature of the imposed eigenvectors. Indeed, if N-N bond lengths are
corrected to the equilibrium bond lengths, this trend towards metallisation is lost.
Only a small reduction in the bad gap is observed at very large perturbations from
the equilibrium geometry. The large difference observed between rectilinear and
corrected distortions clearly shows that the addition of internal molecular modes
may be promising to induce metallisation.
Along M 9 , the band gap is seen to decrease very slightly before returning towards
its equilibrium band gap at higher distortions, Fig. 3.10c. In stark contrast, however,
the band gap decreases markedly along M 16 , Fig. 3.10d. Imposing very large perturbations along this eigenvector (to a factor of 8) decreases the band gap asymptotically
to ca. 0.15 eV, but does not reach metallisation, Fig. 3.11. This is associated with
U ≈ 5.6 eV.
85
Fig. 3.9 Phonon dispersion
curve calculated using
PBE-D2 for the primitive
cell of α-NaN 3 . The zone
centre frequencies calculated
with LO-TO correction are
highlighted as pink dots
3.5.2.1 Band Gap Dependence on External Lattice Modes in α-NaN 3
The DFT-D2 scheme leads to reliable calculation of the external vibrational modes
and hence can be used for further investigation. It is convenient to begin with discussion of the external vibrational modes that contain no Na character, M 6 ,M 8 , M 9 and
M 16 (Table 3.5). These four modes correspond to tilting of the N
−
3 molecules. In
the first, azide molecules tilt in phase, polarized primarily along the crystallographic
b-axis. The second corresponds to a tilt along this same axis, with each of the azido
anions tilting out of phase with one another. Hence, these modes correspond to the
zone centre and primitive Brillouin zone edge, respectively. Modes M 9 and M 16
describe the same motion polarized primarily along the crystallographic a-axis.
As M 6 and M 8 are followed, the band gap is found to decrease dramatically
(i.e. towards metallisation), Fig. 3.10a,b. However, this appears to be an artefact of
the rectilinear nature of the imposed eigenvectors. Indeed, if N-N bond lengths are
corrected to the equilibrium bond lengths, this trend towards metallisation is lost.
Only a small reduction in the bad gap is observed at very large perturbations from
the equilibrium geometry. The large difference observed between rectilinear and
corrected distortions clearly shows that the addition of internal molecular modes
may be promising to induce metallisation.
Along M 9 , the band gap is seen to decrease very slightly before returning towards
its equilibrium band gap at higher distortions, Fig. 3.10c. In stark contrast, however,
the band gap decreases markedly along M 16 , Fig. 3.10d. Imposing very large perturbations along this eigenvector (to a factor of 8) decreases the band gap asymptotically
to ca. 0.15 eV, but does not reach metallisation, Fig. 3.11. This is associated with
U ≈ 5.6 eV.