

80
3 Vibrational Up-Pumping: Predicting Impact Sensitivity of Some …
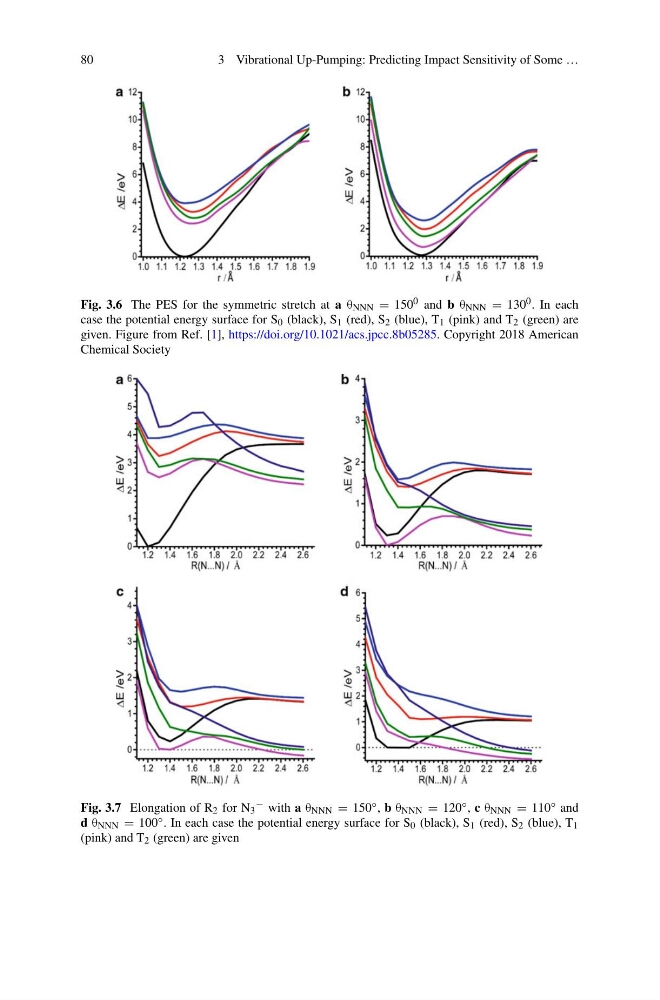
Fig. 3.6 The PES for the symmetric stretch at a θ NNN = 150 0 and b θ NNN = 130 0 . In each
case the potential energy surface for S 0 (black), S 1 (red), S 2 (blue), T 1 (pink) and T 2 (green) are
given. Figure from Ref. [1], https://doi.org/10.1021/acs.jpcc.8b05285. Copyright 2018 American
Chemical Society
Fig. 3.7 Elongation of R 2 for N 3
− with a θ NNN = 150 ◦ , b θ NNN = 120 ◦ , c θ NNN = 110 ◦ and
d θ NNN = 100 ◦ . In each case the potential energy surface for S 0 (black), S 1 (red), S 2 (blue), T 1
(pink) and T 2 (green) are given
3 Vibrational Up-Pumping: Predicting Impact Sensitivity of Some …
Fig. 3.6 The PES for the symmetric stretch at a θ NNN = 150 0 and b θ NNN = 130 0 . In each
case the potential energy surface for S 0 (black), S 1 (red), S 2 (blue), T 1 (pink) and T 2 (green) are
given. Figure from Ref. [1], https://doi.org/10.1021/acs.jpcc.8b05285. Copyright 2018 American
Chemical Society
Fig. 3.7 Elongation of R 2 for N 3
− with a θ NNN = 150 ◦ , b θ NNN = 120 ◦ , c θ NNN = 110 ◦ and
d θ NNN = 100 ◦ . In each case the potential energy surface for S 0 (black), S 1 (red), S 2 (blue), T 1
(pink) and T 2 (green) are given