

normal. An inductively coupled plasma mass spectrometer (ICP-MS; XSERIES II,
Thermo Fisher Scientific) was used under the following conditions: neb pressure:
1.9 bar; neb gas flow: 0.87 L min
À1 ; pump rate: 38 rpm; cool gas flow: 13 L min
À1 ;
auxiliary gas flow: 0.7 L min
À1 ; fwd power: 1349 W; ref.: 2 W; load: 69; tune: 153;
expansion pressure: 2.2 Â 10
0 mbar; analyzer chamber pressure: 3.5 Â 10
À7 mbar;
extraction: À90; Lens 1: À1110; Lens 2: À77.6; Focus: 12.5; D1: À42.4; D2: À140.
A standard solution of 1000 ppm/matrix 2% HNO 3 (High-Purity Standards Inc.,
North Charleston, SC, USA) was used for calibration. Four replicates of the powdered sclerotia samples between 20 and 25 mg were applied for measurement and
were placed in a beaker with 0.3 mL of ultra-pure nitric acid on a hotplate at 120
C
for approximately 5 min. Then 0.1 mL of 30% hydrogen peroxide solution was
added to the residue and heated at <100
C for 2 min until almost evaporated,
whereupon 0.6 mL of 0.1 M nitric acid was added. Finally, the solution was again
evaporated almost to dryness at 130–140
C. The residue was dissolved in 1 mL of
0.1 M HNO 3 to produce a clear solution. The ICP analysis was preceded by three
major steps: sample preparation, sample digestion, and instrumental measurement.
As it is instructive to evaluate the magnitude of the variance in the results, the
dispersion or relative standard deviation of individual samples around the mean was
measured as the variance (s
2 ) according to Montgomery (1991).
The variance, or relative standard deviation (srΣ) was calculated as follows:
S
2
rΣ ¼
ffiffiffiffiffiffiffiffiffiffiffiffiffiffiffiffiffiffiffiffiffiffiffiffiffiffi ffi
S
2
rr þ S
2
rt þ S
2
rs
q
;
ð5:2Þ
where s
2
rr is the reproducibility of the analytical results for the solutions and depends
on instrumentation stability, including the stability of the positioning of a sample in
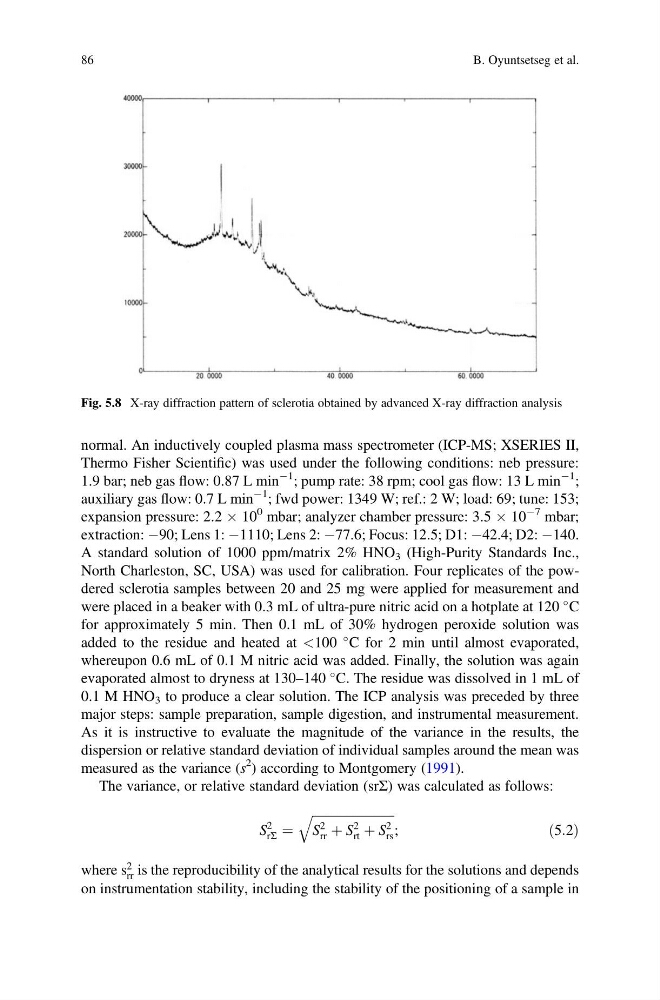
Fig. 5.8 X-ray diffraction pattern of sclerotia obtained by advanced X-ray diffraction analysis
86
B. Oyuntsetseg et al.
Thermo Fisher Scientific) was used under the following conditions: neb pressure:
1.9 bar; neb gas flow: 0.87 L min
À1 ; pump rate: 38 rpm; cool gas flow: 13 L min
À1 ;
auxiliary gas flow: 0.7 L min
À1 ; fwd power: 1349 W; ref.: 2 W; load: 69; tune: 153;
expansion pressure: 2.2 Â 10
0 mbar; analyzer chamber pressure: 3.5 Â 10
À7 mbar;
extraction: À90; Lens 1: À1110; Lens 2: À77.6; Focus: 12.5; D1: À42.4; D2: À140.
A standard solution of 1000 ppm/matrix 2% HNO 3 (High-Purity Standards Inc.,
North Charleston, SC, USA) was used for calibration. Four replicates of the powdered sclerotia samples between 20 and 25 mg were applied for measurement and
were placed in a beaker with 0.3 mL of ultra-pure nitric acid on a hotplate at 120
C
for approximately 5 min. Then 0.1 mL of 30% hydrogen peroxide solution was
added to the residue and heated at <100
C for 2 min until almost evaporated,
whereupon 0.6 mL of 0.1 M nitric acid was added. Finally, the solution was again
evaporated almost to dryness at 130–140
C. The residue was dissolved in 1 mL of
0.1 M HNO 3 to produce a clear solution. The ICP analysis was preceded by three
major steps: sample preparation, sample digestion, and instrumental measurement.
As it is instructive to evaluate the magnitude of the variance in the results, the
dispersion or relative standard deviation of individual samples around the mean was
measured as the variance (s
2 ) according to Montgomery (1991).
The variance, or relative standard deviation (srΣ) was calculated as follows:
S
2
rΣ ¼
ffiffiffiffiffiffiffiffiffiffiffiffiffiffiffiffiffiffiffiffiffiffiffiffiffiffi ffi
S
2
rr þ S
2
rt þ S
2
rs
q
;
ð5:2Þ
where s
2
rr is the reproducibility of the analytical results for the solutions and depends
on instrumentation stability, including the stability of the positioning of a sample in
Fig. 5.8 X-ray diffraction pattern of sclerotia obtained by advanced X-ray diffraction analysis
86
B. Oyuntsetseg et al.