

4.4.2.3 Sclerotia Colonization
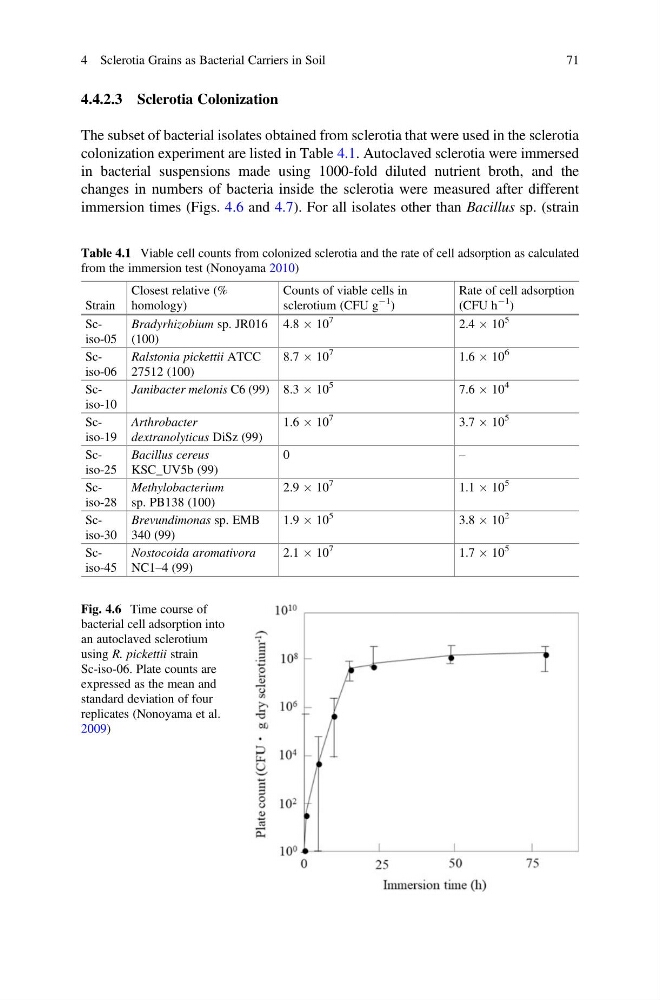
The subset of bacterial isolates obtained from sclerotia that were used in the sclerotia
colonization experiment are listed in Table 4.1. Autoclaved sclerotia were immersed
in bacterial suspensions made using 1000-fold diluted nutrient broth, and the
changes in numbers of bacteria inside the sclerotia were measured after different
immersion times (Figs. 4.6 and 4.7). For all isolates other than Bacillus sp. (strain
Table 4.1 Viable cell counts from colonized sclerotia and the rate of cell adsorption as calculated
from the immersion test (Nonoyama 2010)
Strain
Closest relative (%
homology)
Counts of viable cells in
sclerotium (CFU g
À1
)
Rate of cell adsorption
(CFU h
À1
)
Sciso-05
Bradyrhizobium sp. JR016
(100)
4.8 Â 10
7
2.4 Â 10
5
Sciso-06
Ralstonia pickettii ATCC
27512 (100)
8.7 Â 10
7
1.6 Â 10
6
Sciso-10
Janibacter melonis C6 (99) 8.3 Â 10
5
7.6 Â 10
4
Sciso-19
Arthrobacter
dextranolyticus DiSz (99)
1.6 Â 10
7
3.7 Â 10
5
Sciso-25
Bacillus cereus
KSC_UV5b (99)
0
–
Sciso-28
Methylobacterium
sp. PB138 (100)
2.9 Â 10
7
1.1 Â 10
5
Sciso-30
Brevundimonas sp. EMB
340 (99)
1.9 Â 10
5
3.8 Â 10
2
Sciso-45
Nostocoida aromativora
NC1–4 (99)
2.1 Â 10
7
1.7 Â 10
5
Fig. 4.6 Time course of
bacterial cell adsorption into
an autoclaved sclerotium
using R. pickettii strain
Sc-iso-06. Plate counts are
expressed as the mean and
standard deviation of four
replicates (Nonoyama et al.
2009)
4 Sclerotia Grains as Bacterial Carriers in Soil
71
The subset of bacterial isolates obtained from sclerotia that were used in the sclerotia
colonization experiment are listed in Table 4.1. Autoclaved sclerotia were immersed
in bacterial suspensions made using 1000-fold diluted nutrient broth, and the
changes in numbers of bacteria inside the sclerotia were measured after different
immersion times (Figs. 4.6 and 4.7). For all isolates other than Bacillus sp. (strain
Table 4.1 Viable cell counts from colonized sclerotia and the rate of cell adsorption as calculated
from the immersion test (Nonoyama 2010)
Strain
Closest relative (%
homology)
Counts of viable cells in
sclerotium (CFU g
À1
)
Rate of cell adsorption
(CFU h
À1
)
Sciso-05
Bradyrhizobium sp. JR016
(100)
4.8 Â 10
7
2.4 Â 10
5
Sciso-06
Ralstonia pickettii ATCC
27512 (100)
8.7 Â 10
7
1.6 Â 10
6
Sciso-10
Janibacter melonis C6 (99) 8.3 Â 10
5
7.6 Â 10
4
Sciso-19
Arthrobacter
dextranolyticus DiSz (99)
1.6 Â 10
7
3.7 Â 10
5
Sciso-25
Bacillus cereus
KSC_UV5b (99)
0
–
Sciso-28
Methylobacterium
sp. PB138 (100)
2.9 Â 10
7
1.1 Â 10
5
Sciso-30
Brevundimonas sp. EMB
340 (99)
1.9 Â 10
5
3.8 Â 10
2
Sciso-45
Nostocoida aromativora
NC1–4 (99)
2.1 Â 10
7
1.7 Â 10
5
Fig. 4.6 Time course of
bacterial cell adsorption into
an autoclaved sclerotium
using R. pickettii strain
Sc-iso-06. Plate counts are
expressed as the mean and
standard deviation of four
replicates (Nonoyama et al.
2009)
4 Sclerotia Grains as Bacterial Carriers in Soil
71