

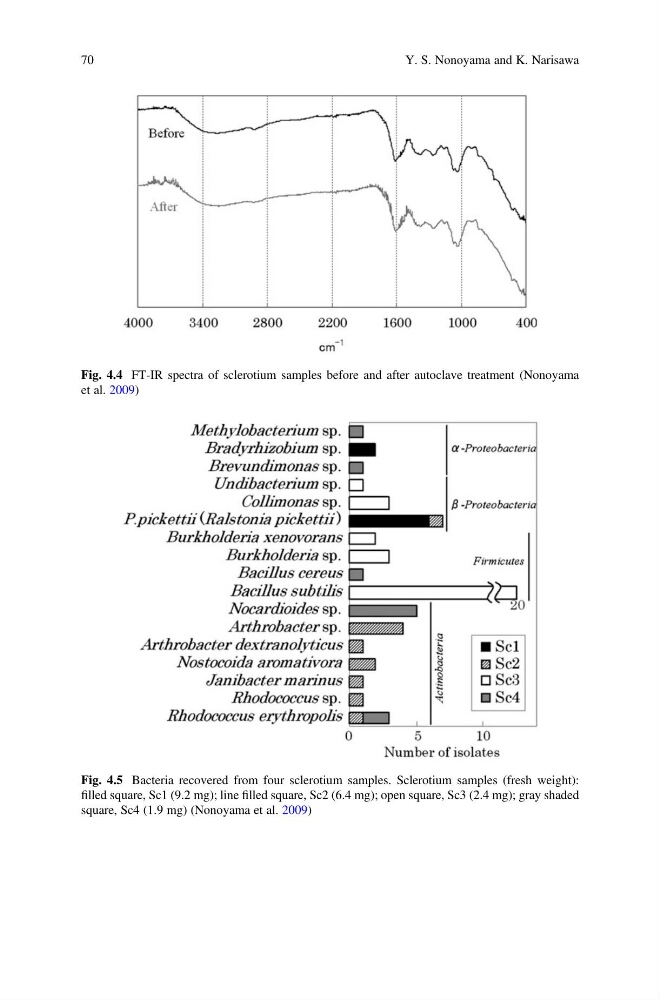
Fig. 4.4 FT-IR spectra of sclerotium samples before and after autoclave treatment (Nonoyama
et al. 2009)
Fig. 4.5 Bacteria recovered from four sclerotium samples. Sclerotium samples (fresh weight):
filled square, Sc1 (9.2 mg); line filled square, Sc2 (6.4 mg); open square, Sc3 (2.4 mg); gray shaded
square, Sc4 (1.9 mg) (Nonoyama et al. 2009)
70
Y. S. Nonoyama and K. Narisawa
et al. 2009)
Fig. 4.5 Bacteria recovered from four sclerotium samples. Sclerotium samples (fresh weight):
filled square, Sc1 (9.2 mg); line filled square, Sc2 (6.4 mg); open square, Sc3 (2.4 mg); gray shaded
square, Sc4 (1.9 mg) (Nonoyama et al. 2009)
70
Y. S. Nonoyama and K. Narisawa