

3.4 Model of Relationship Between Sclerotia Formation
and Soil Mesofauna Mediated Via
Ectomycorrhizal Fungi
One of the focuses of this study was to investigate the role of mesofauna in sclerotia
formation by using T-RFLP analysis to determine the abundance of ectomycorrhizal
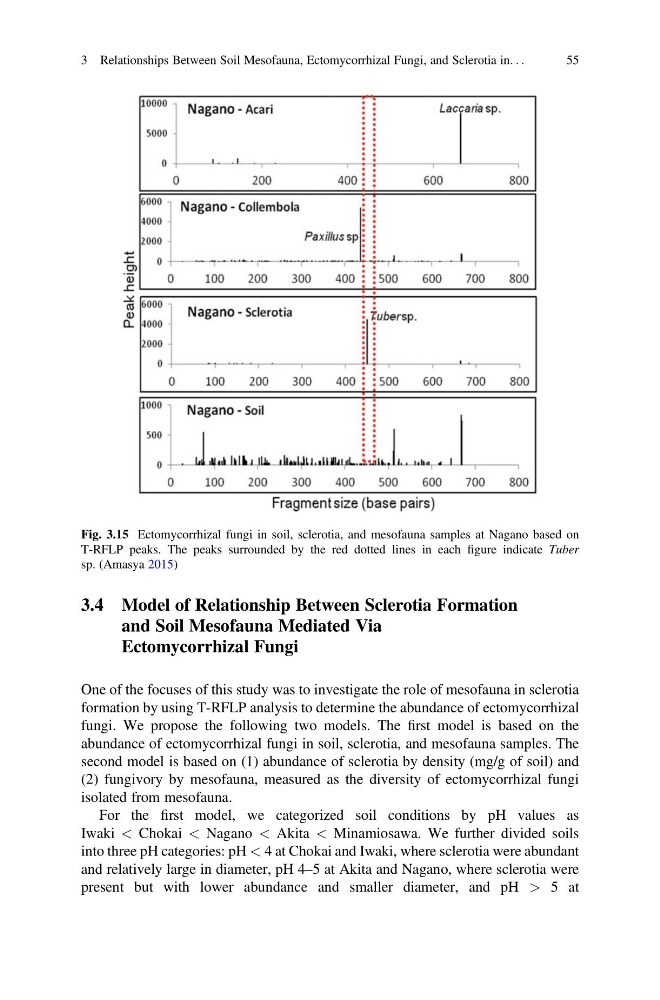
fungi. We propose the following two models. The first model is based on the
abundance of ectomycorrhizal fungi in soil, sclerotia, and mesofauna samples. The
second model is based on (1) abundance of sclerotia by density (mg/g of soil) and
(2) fungivory by mesofauna, measured as the diversity of ectomycorrhizal fungi
isolated from mesofauna.
For the first model, we categorized soil conditions by pH values as
Iwaki < Chokai < Nagano < Akita < Minamiosawa. We further divided soils
into three pH categories: pH < 4 at Chokai and Iwaki, where sclerotia were abundant
and relatively large in diameter, pH 4–5 at Akita and Nagano, where sclerotia were
present but with lower abundance and smaller diameter, and pH > 5 at
Fig. 3.15 Ectomycorrhizal fungi in soil, sclerotia, and mesofauna samples at Nagano based on
T-RFLP peaks. The peaks surrounded by the red dotted lines in each figure indicate Tuber
sp. (Amasya 2015)
3 Relationships Between Soil Mesofauna, Ectomycorrhizal Fungi, and Sclerotia in. . .
55
and Soil Mesofauna Mediated Via
Ectomycorrhizal Fungi
One of the focuses of this study was to investigate the role of mesofauna in sclerotia
formation by using T-RFLP analysis to determine the abundance of ectomycorrhizal
fungi. We propose the following two models. The first model is based on the
abundance of ectomycorrhizal fungi in soil, sclerotia, and mesofauna samples. The
second model is based on (1) abundance of sclerotia by density (mg/g of soil) and
(2) fungivory by mesofauna, measured as the diversity of ectomycorrhizal fungi
isolated from mesofauna.
For the first model, we categorized soil conditions by pH values as
Iwaki < Chokai < Nagano < Akita < Minamiosawa. We further divided soils
into three pH categories: pH < 4 at Chokai and Iwaki, where sclerotia were abundant
and relatively large in diameter, pH 4–5 at Akita and Nagano, where sclerotia were
present but with lower abundance and smaller diameter, and pH > 5 at
Fig. 3.15 Ectomycorrhizal fungi in soil, sclerotia, and mesofauna samples at Nagano based on
T-RFLP peaks. The peaks surrounded by the red dotted lines in each figure indicate Tuber
sp. (Amasya 2015)
3 Relationships Between Soil Mesofauna, Ectomycorrhizal Fungi, and Sclerotia in. . .
55