

<1.69 mg g
À1 , the sclerotia content of the Elend Ah horizon, as shown in Fig. 10.3.
However, anomalous distribution of sclerotia was observed at some points, as
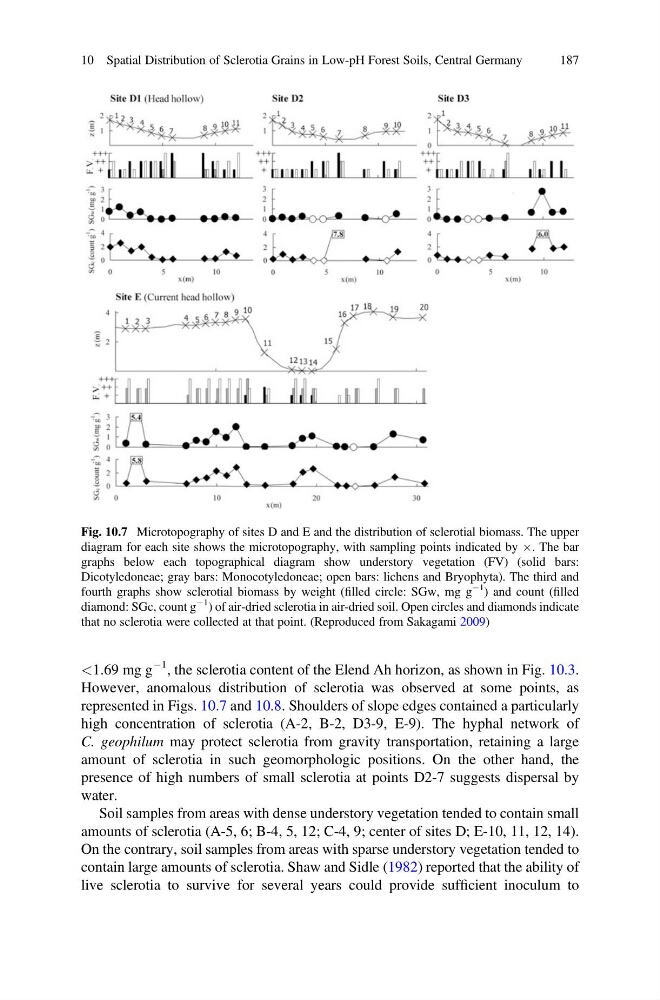
represented in Figs. 10.7 and 10.8. Shoulders of slope edges contained a particularly
high concentration of sclerotia (A-2, B-2, D3-9, E-9). The hyphal network of
C. geophilum may protect sclerotia from gravity transportation, retaining a large
amount of sclerotia in such geomorphologic positions. On the other hand, the
presence of high numbers of small sclerotia at points D2-7 suggests dispersal by
water.
Soil samples from areas with dense understory vegetation tended to contain small
amounts of sclerotia (A-5, 6; B-4, 5, 12; C-4, 9; center of sites D; E-10, 11, 12, 14).
On the contrary, soil samples from areas with sparse understory vegetation tended to
contain large amounts of sclerotia. Shaw and Sidle (1982) reported that the ability of
live sclerotia to survive for several years could provide sufficient inoculum to
Fig. 10.7 Microtopography of sites D and E and the distribution of sclerotial biomass. The upper
diagram for each site shows the microtopography, with sampling points indicated by Â. The bar
graphs below each topographical diagram show understory vegetation (FV) (solid bars:
Dicotyledoneae; gray bars: Monocotyledoneae; open bars: lichens and Bryophyta). The third and
fourth graphs show sclerotial biomass by weight (filled circle: SGw, mg g
À1
) and count (filled
diamond: SGc, count g
À1
) of air-dried sclerotia in air-dried soil. Open circles and diamonds indicate
that no sclerotia were collected at that point. (Reproduced from Sakagami 2009)
10 Spatial Distribution of Sclerotia Grains in Low-pH Forest Soils, Central Germany
187
À1 , the sclerotia content of the Elend Ah horizon, as shown in Fig. 10.3.
However, anomalous distribution of sclerotia was observed at some points, as
represented in Figs. 10.7 and 10.8. Shoulders of slope edges contained a particularly
high concentration of sclerotia (A-2, B-2, D3-9, E-9). The hyphal network of
C. geophilum may protect sclerotia from gravity transportation, retaining a large
amount of sclerotia in such geomorphologic positions. On the other hand, the
presence of high numbers of small sclerotia at points D2-7 suggests dispersal by
water.
Soil samples from areas with dense understory vegetation tended to contain small
amounts of sclerotia (A-5, 6; B-4, 5, 12; C-4, 9; center of sites D; E-10, 11, 12, 14).
On the contrary, soil samples from areas with sparse understory vegetation tended to
contain large amounts of sclerotia. Shaw and Sidle (1982) reported that the ability of
live sclerotia to survive for several years could provide sufficient inoculum to
Fig. 10.7 Microtopography of sites D and E and the distribution of sclerotial biomass. The upper
diagram for each site shows the microtopography, with sampling points indicated by Â. The bar
graphs below each topographical diagram show understory vegetation (FV) (solid bars:
Dicotyledoneae; gray bars: Monocotyledoneae; open bars: lichens and Bryophyta). The third and
fourth graphs show sclerotial biomass by weight (filled circle: SGw, mg g
À1
) and count (filled
diamond: SGc, count g
À1
) of air-dried sclerotia in air-dried soil. Open circles and diamonds indicate
that no sclerotia were collected at that point. (Reproduced from Sakagami 2009)
10 Spatial Distribution of Sclerotia Grains in Low-pH Forest Soils, Central Germany
187