

Figure 9.15 shows a strong positive relationship between the C/N ratio and mean
weight of sclerotia. According to Littke et al. (1984) and LoBuglio (1999), Cg was
observed to grow more rapidly at low N concentrations, but at the expense of
biomass production. It is suggested that sclerotia may enlarge their sizes in soil of
low N concentrations with association of preservation of their species. As it is known
that approximately 50 wt% of sclerotia consists of C (Watanabe et al. 2007a), the
contribution of carbon in sclerotia to soil T-C can be estimated from the following
equation “Sclerotial C contribution (%) ¼ (Weight density of sclerotia  0.5)/
(T-C) Â 100.”
The average of their contribution in the studied area was 0.17% and the maximum
contribution was 0.96% in mineral soil under P. pumila at Mt. Ontake (Point 15).
Sclerotia had an optimum distribution in cool-temperate and subalpine vegetation
zones with a distinct peak at the boundary of these two zones. Sclerotia content
showed larger seasonal variance compared to T-C, presumably due to activities of
micro-organisms. Soils of which large amounts of sclerotia were accumulated, such
as Mt. Iwaki and Mt. Ontake, are likely to be resulted from lower decomposing rates
of soil organics due to the lower temperatures. Although the contribution of sclerotial carbon to total soil carbon (T-C) is small (<0.96%), sclerotia should have an
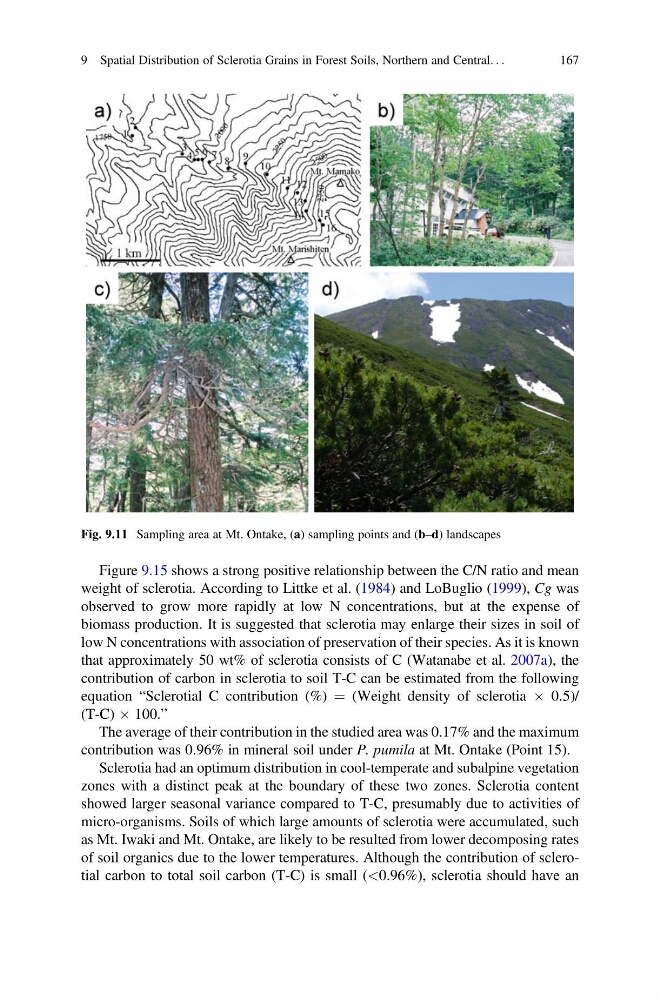
Fig. 9.11 Sampling area at Mt. Ontake, (a) sampling points and (b–d) landscapes
9 Spatial Distribution of Sclerotia Grains in Forest Soils, Northern and Central. . .
167
weight of sclerotia. According to Littke et al. (1984) and LoBuglio (1999), Cg was
observed to grow more rapidly at low N concentrations, but at the expense of
biomass production. It is suggested that sclerotia may enlarge their sizes in soil of
low N concentrations with association of preservation of their species. As it is known
that approximately 50 wt% of sclerotia consists of C (Watanabe et al. 2007a), the
contribution of carbon in sclerotia to soil T-C can be estimated from the following
equation “Sclerotial C contribution (%) ¼ (Weight density of sclerotia  0.5)/
(T-C) Â 100.”
The average of their contribution in the studied area was 0.17% and the maximum
contribution was 0.96% in mineral soil under P. pumila at Mt. Ontake (Point 15).
Sclerotia had an optimum distribution in cool-temperate and subalpine vegetation
zones with a distinct peak at the boundary of these two zones. Sclerotia content
showed larger seasonal variance compared to T-C, presumably due to activities of
micro-organisms. Soils of which large amounts of sclerotia were accumulated, such
as Mt. Iwaki and Mt. Ontake, are likely to be resulted from lower decomposing rates
of soil organics due to the lower temperatures. Although the contribution of sclerotial carbon to total soil carbon (T-C) is small (<0.96%), sclerotia should have an
Fig. 9.11 Sampling area at Mt. Ontake, (a) sampling points and (b–d) landscapes
9 Spatial Distribution of Sclerotia Grains in Forest Soils, Northern and Central. . .
167