

14 C dating) contained a large amount of phosphorus (1.36 Æ 1.80 wt%). Plots of
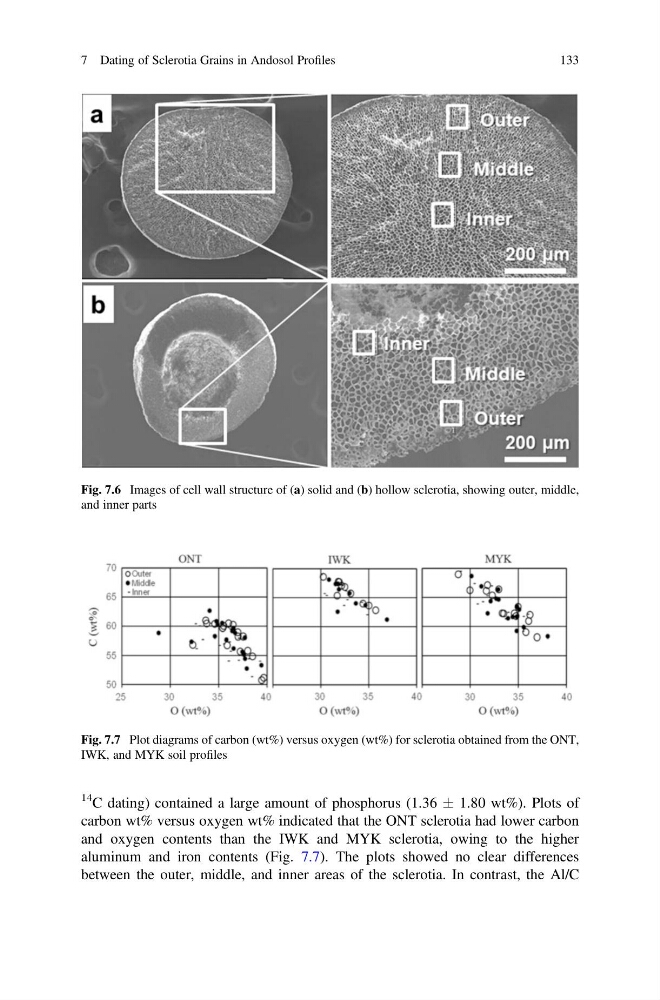
carbon wt% versus oxygen wt% indicated that the ONT sclerotia had lower carbon
and oxygen contents than the IWK and MYK sclerotia, owing to the higher
aluminum and iron contents (Fig. 7.7). The plots showed no clear differences
between the outer, middle, and inner areas of the sclerotia. In contrast, the Al/C
Fig. 7.6 Images of cell wall structure of (a) solid and (b) hollow sclerotia, showing outer, middle,
and inner parts
Fig. 7.7 Plot diagrams of carbon (wt%) versus oxygen (wt%) for sclerotia obtained from the ONT,
IWK, and MYK soil profiles
7 Dating of Sclerotia Grains in Andosol Profiles
133
carbon wt% versus oxygen wt% indicated that the ONT sclerotia had lower carbon
and oxygen contents than the IWK and MYK sclerotia, owing to the higher
aluminum and iron contents (Fig. 7.7). The plots showed no clear differences
between the outer, middle, and inner areas of the sclerotia. In contrast, the Al/C
Fig. 7.6 Images of cell wall structure of (a) solid and (b) hollow sclerotia, showing outer, middle,
and inner parts
Fig. 7.7 Plot diagrams of carbon (wt%) versus oxygen (wt%) for sclerotia obtained from the ONT,
IWK, and MYK soil profiles
7 Dating of Sclerotia Grains in Andosol Profiles
133