

measurement was determined by grain size, as noted in Table 7.2. All samples were
oxidized to CO 2 gas. The CO 2 gas was purified and then graphitized by hydrogen
gas with iron powder as the catalyst. Graphite samples were pressed with iron
powder into cathode cones to be set at the ion source of the AMS system.
14 C/
12 C
sample data were normalized using
14 C/
12 C standards. New oxalic acid provided by
NIST (SRM 4990C) was used as a standard material.
14 C ages were calculated
according to the procedures of Stuiver and Polach (1977) and calibration for
calendar age was performed by using the INTCAL98 and OxCal calibration program
v3.9 (Ramsey 1995, 2001). The AMS measurement was repeated four times for each
sample.
7.2.2
14
C Ages of Sclerotia in Andosol Profiles
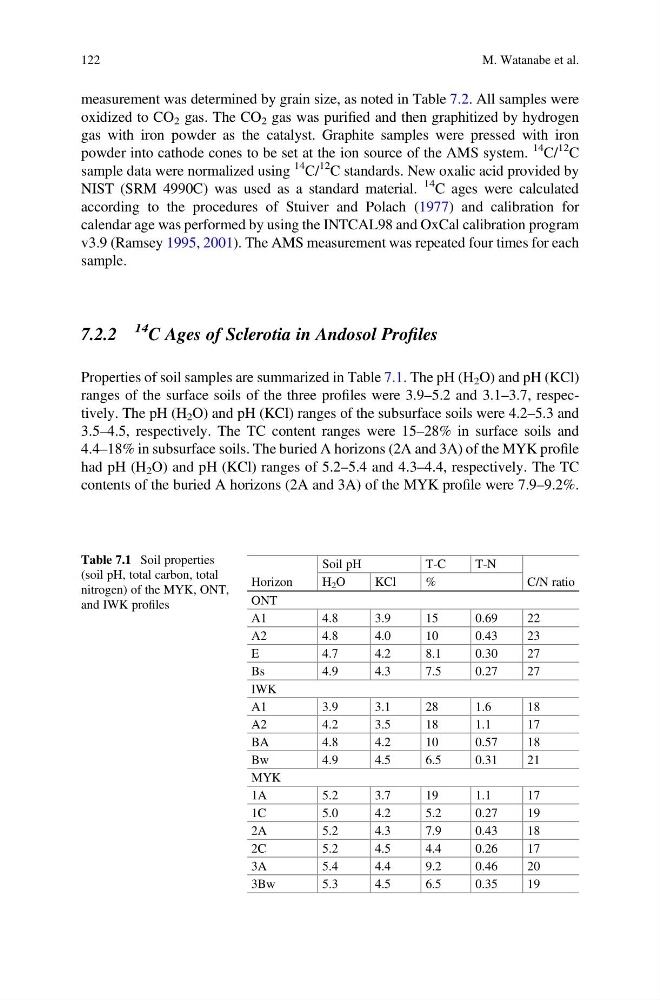
Properties of soil samples are summarized in Table 7.1. The pH (H 2 O) and pH (KCl)
ranges of the surface soils of the three profiles were 3.9–5.2 and 3.1–3.7, respectively. The pH (H 2 O) and pH (KCl) ranges of the subsurface soils were 4.2–5.3 and
3.5–4.5, respectively. The TC content ranges were 15–28% in surface soils and
4.4–18% in subsurface soils. The buried A horizons (2A and 3A) of the MYK profile
had pH (H 2 O) and pH (KCl) ranges of 5.2–5.4 and 4.3–4.4, respectively. The TC
contents of the buried A horizons (2A and 3A) of the MYK profile were 7.9–9.2%.
Table 7.1 Soil properties
(soil pH, total carbon, total
nitrogen) of the MYK, ONT,
and IWK profiles
Horizon
Soil pH
T-C
T-N
C/N ratio
H 2 O
KCl
%
ONT
A1
4.8
3.9
15
0.69
22
A2
4.8
4.0
10
0.43
23
E
4.7
4.2
8.1
0.30
27
Bs
4.9
4.3
7.5
0.27
27
IWK
A1
3.9
3.1
28
1.6
18
A2
4.2
3.5
18
1.1
17
BA
4.8
4.2
10
0.57
18
Bw
4.9
4.5
6.5
0.31
21
MYK
1A
5.2
3.7
19
1.1
17
1C
5.0
4.2
5.2
0.27
19
2A
5.2
4.3
7.9
0.43
18
2C
5.2
4.5
4.4
0.26
17
3A
5.4
4.4
9.2
0.46
20
3Bw
5.3
4.5
6.5
0.35
19
122
M. Watanabe et al.
oxidized to CO 2 gas. The CO 2 gas was purified and then graphitized by hydrogen
gas with iron powder as the catalyst. Graphite samples were pressed with iron
powder into cathode cones to be set at the ion source of the AMS system.
14 C/
12 C
sample data were normalized using
14 C/
12 C standards. New oxalic acid provided by
NIST (SRM 4990C) was used as a standard material.
14 C ages were calculated
according to the procedures of Stuiver and Polach (1977) and calibration for
calendar age was performed by using the INTCAL98 and OxCal calibration program
v3.9 (Ramsey 1995, 2001). The AMS measurement was repeated four times for each
sample.
7.2.2
14
C Ages of Sclerotia in Andosol Profiles
Properties of soil samples are summarized in Table 7.1. The pH (H 2 O) and pH (KCl)
ranges of the surface soils of the three profiles were 3.9–5.2 and 3.1–3.7, respectively. The pH (H 2 O) and pH (KCl) ranges of the subsurface soils were 4.2–5.3 and
3.5–4.5, respectively. The TC content ranges were 15–28% in surface soils and
4.4–18% in subsurface soils. The buried A horizons (2A and 3A) of the MYK profile
had pH (H 2 O) and pH (KCl) ranges of 5.2–5.4 and 4.3–4.4, respectively. The TC
contents of the buried A horizons (2A and 3A) of the MYK profile were 7.9–9.2%.
Table 7.1 Soil properties
(soil pH, total carbon, total
nitrogen) of the MYK, ONT,
and IWK profiles
Horizon
Soil pH
T-C
T-N
C/N ratio
H 2 O
KCl
%
ONT
A1
4.8
3.9
15
0.69
22
A2
4.8
4.0
10
0.43
23
E
4.7
4.2
8.1
0.30
27
Bs
4.9
4.3
7.5
0.27
27
IWK
A1
3.9
3.1
28
1.6
18
A2
4.2
3.5
18
1.1
17
BA
4.8
4.2
10
0.57
18
Bw
4.9
4.5
6.5
0.31
21
MYK
1A
5.2
3.7
19
1.1
17
1C
5.0
4.2
5.2
0.27
19
2A
5.2
4.3
7.9
0.43
18
2C
5.2
4.5
4.4
0.26
17
3A
5.4
4.4
9.2
0.46
20
3Bw
5.3
4.5
6.5
0.35
19
122
M. Watanabe et al.