

0
10
20
30
40
50
60
70
Pampas grass
Bamboo grass
Goldenrod
Barley
Paddy rice
Molar percent
α
(A)
0
10
20
30
40
50
60
70
Japanese white birch
Northern Japanese hemlock
Korean pine
Japanese thuja
Maries fir
α
Molar percent
(B)
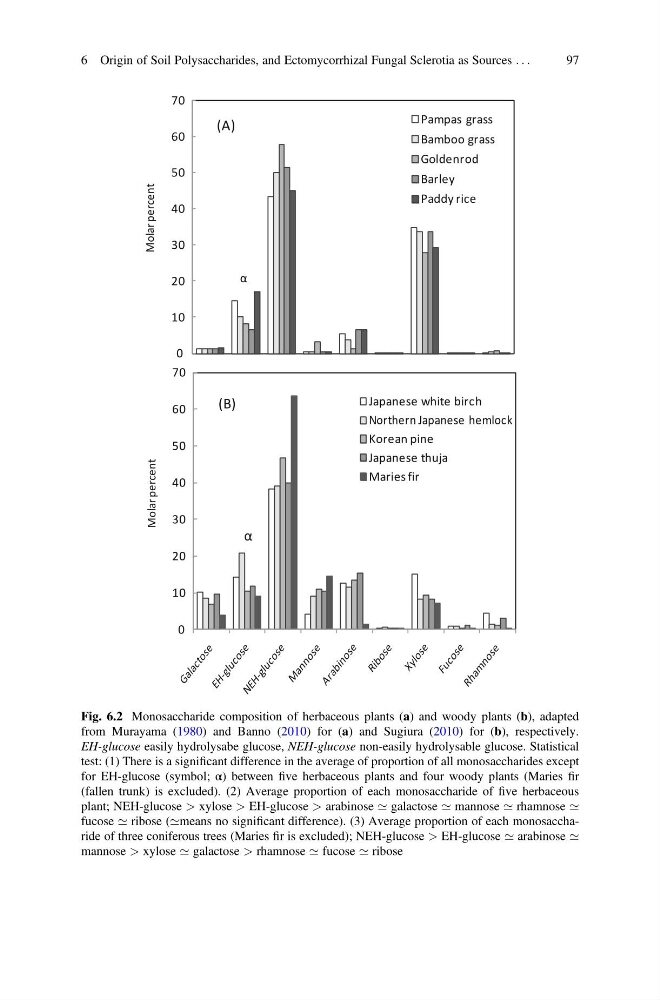
Fig. 6.2 Monosaccharide composition of herbaceous plants (a) and woody plants (b), adapted
from Murayama (1980) and Banno (2010) for (a) and Sugiura (2010) for (b), respectively.
EH-glucose easily hydrolysabe glucose, NEH-glucose non-easily hydrolysable glucose. Statistical
test: (1) There is a significant difference in the average of proportion of all monosaccharides except
for EH-glucose (symbol; α) between five herbaceous plants and four woody plants (Maries fir
(fallen trunk) is excluded). (2) Average proportion of each monosaccharide of five herbaceous
plant; NEH-glucose > xylose > EH-glucose > arabinose ’ galactose ’ mannose ’ rhamnose ’
fucose ’ ribose (’means no significant difference). (3) Average proportion of each monosaccharide of three coniferous trees (Maries fir is excluded); NEH-glucose > EH-glucose ’ arabinose ’
mannose > xylose ’ galactose > rhamnose ’ fucose ’ ribose
6 Origin of Soil Polysaccharides, and Ectomycorrhizal Fungal Sclerotia as Sources . . .
97
10
20
30
40
50
60
70
Pampas grass
Bamboo grass
Goldenrod
Barley
Paddy rice
Molar percent
α
(A)
0
10
20
30
40
50
60
70
Japanese white birch
Northern Japanese hemlock
Korean pine
Japanese thuja
Maries fir
α
Molar percent
(B)
Fig. 6.2 Monosaccharide composition of herbaceous plants (a) and woody plants (b), adapted
from Murayama (1980) and Banno (2010) for (a) and Sugiura (2010) for (b), respectively.
EH-glucose easily hydrolysabe glucose, NEH-glucose non-easily hydrolysable glucose. Statistical
test: (1) There is a significant difference in the average of proportion of all monosaccharides except
for EH-glucose (symbol; α) between five herbaceous plants and four woody plants (Maries fir
(fallen trunk) is excluded). (2) Average proportion of each monosaccharide of five herbaceous
plant; NEH-glucose > xylose > EH-glucose > arabinose ’ galactose ’ mannose ’ rhamnose ’
fucose ’ ribose (’means no significant difference). (3) Average proportion of each monosaccharide of three coniferous trees (Maries fir is excluded); NEH-glucose > EH-glucose ’ arabinose ’
mannose > xylose ’ galactose > rhamnose ’ fucose ’ ribose
6 Origin of Soil Polysaccharides, and Ectomycorrhizal Fungal Sclerotia as Sources . . .
97