

C as shown in Fig. 14 for process FGc40p20). The temperature difference between the retentate and its HCDP locus
was again %40 °C at the beginning of permeation (Fig. 11)
and was reduced to 6 °C at the end of permeation (Fig. 19),
a narrow but acceptable margin to avoid retentate
condensation.
Figure 20 presents a summary of results and a diagnosis
of the performance of process FGc20p7. In brief, the process
(a)
(b)
(c)
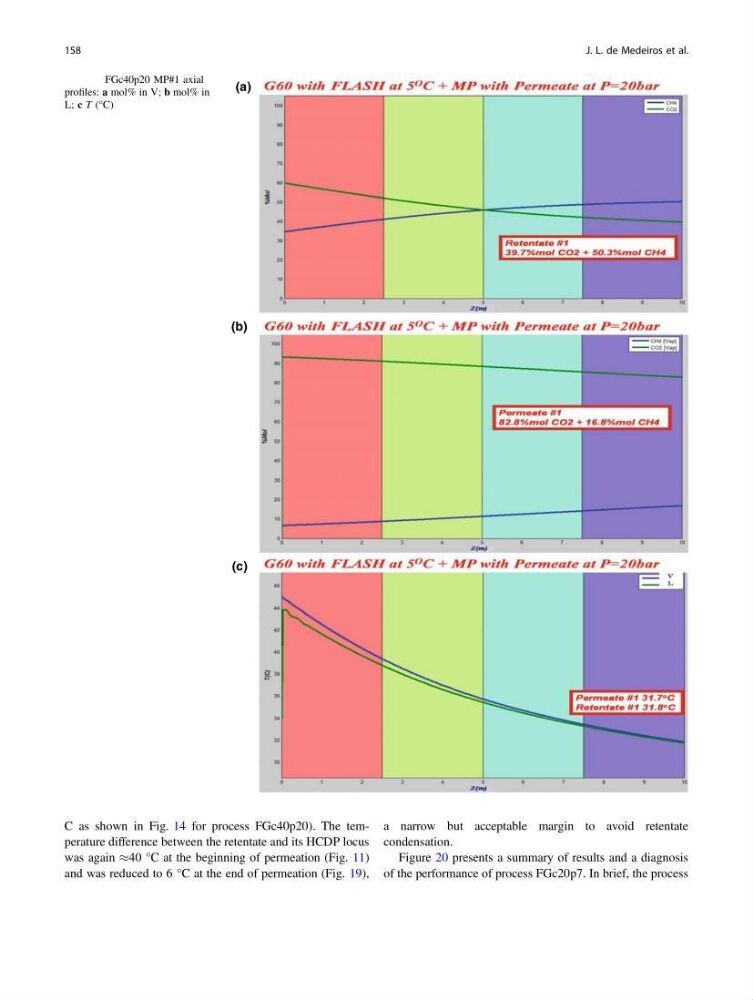
Fig. 13 FGc40p20 MP#1 axial
profiles: a mol% in V; b mol% in
L; c T (°C)
158
J. L. de Medeiros et al.
was again %40 °C at the beginning of permeation (Fig. 11)
and was reduced to 6 °C at the end of permeation (Fig. 19),
a narrow but acceptable margin to avoid retentate
condensation.
Figure 20 presents a summary of results and a diagnosis
of the performance of process FGc20p7. In brief, the process
(a)
(b)
(c)
Fig. 13 FGc40p20 MP#1 axial
profiles: a mol% in V; b mol% in
L; c T (°C)
158
J. L. de Medeiros et al.