

As displayed in Fig. 2, pore-blocking coefficient enhances with TMP and diminishes with shear rate, showing that
both higher shear rate and smaller TMP reduced membrane
fouling. With high shear stress, the great shear-induced
diffusion created, decreasing the deposition and
agglomeration of casein micelles on membrane, as well as
the cake layer fabricated by whey protein and calcium ion,
thus only some pore blocking produced. Besides, higher
TMP caused more obvious concentration polarization, which
also reinforcing pore blocking and membrane pore
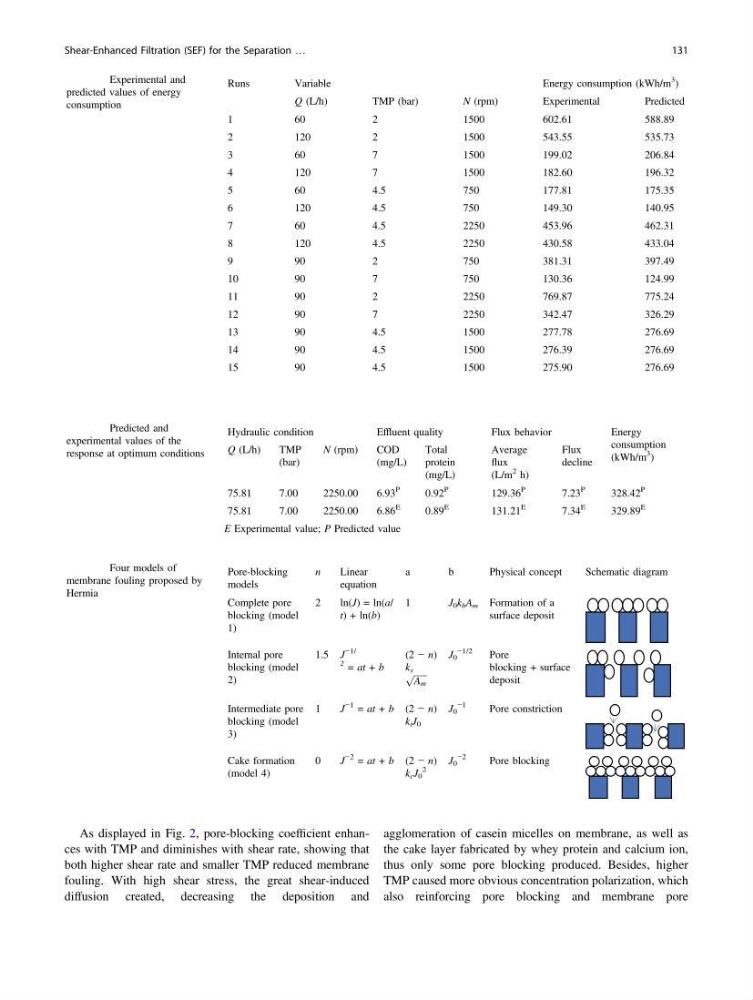
Table 3 Experimental and
predicted values of energy
consumption
Runs
Variable
Energy consumption (kWh/m
3
)
Q (L/h)
TMP (bar)
N (rpm)
Experimental
Predicted
1
60
2
1500
602.61
588.89
2
120
2
1500
543.55
535.73
3
60
7
1500
199.02
206.84
4
120
7
1500
182.60
196.32
5
60
4.5
750
177.81
175.35
6
120
4.5
750
149.30
140.95
7
60
4.5
2250
453.96
462.31
8
120
4.5
2250
430.58
433.04
9
90
2
750
381.31
397.49
10
90
7
750
130.36
124.99
11
90
2
2250
769.87
775.24
12
90
7
2250
342.47
326.29
13
90
4.5
1500
277.78
276.69
14
90
4.5
1500
276.39
276.69
15
90
4.5
1500
275.90
276.69
Table 4 Predicted and
experimental values of the
response at optimum conditions
Hydraulic condition
Effluent quality
Flux behavior
Energy
consumption
(kWh/m
3
)
Q (L/h)
TMP
(bar)
N (rpm)
COD
(mg/L)
Total
protein
(mg/L)
Average
flux
(L/m
2 h)
Flux
decline
75.81
7.00
2250.00
6.93
P
0.92
P
129.36
P
7.23
P
328.42
P
75.81
7.00
2250.00
6.86
E
0.89
E
131.21
E
7.34
E
329.89
E
E Experimental value; P Predicted value
Table 5 Four models of
membrane fouling proposed by
Hermia
Pore-blocking
models
n
Linear
equation
a
b
Physical concept
Schematic diagram
Complete pore
blocking (model
1)
2
ln(J) = ln(a/
t) + ln(b)
1
J 0 k b A m Formation of a
surface deposit
Internal pore
blocking (model
2)
1.5 J
−1/
2 = at + b
(2 − n)
k s ffiffiffiffiffiffi
A m
p
J 0
−1/2
Pore
blocking + surface
deposit
Intermediate pore
blocking (model
3)
1
J
−1 = at + b (2 − n)
k i J 0
J 0
−1
Pore constriction
Cake formation
(model 4)
0
J
−2 = at + b (2 − n)
k c J 0
2
J 0
−2
Pore blocking
Shear-Enhanced Filtration (SEF) for the Separation …
131
both higher shear rate and smaller TMP reduced membrane
fouling. With high shear stress, the great shear-induced
diffusion created, decreasing the deposition and
agglomeration of casein micelles on membrane, as well as
the cake layer fabricated by whey protein and calcium ion,
thus only some pore blocking produced. Besides, higher
TMP caused more obvious concentration polarization, which
also reinforcing pore blocking and membrane pore
Table 3 Experimental and
predicted values of energy
consumption
Runs
Variable
Energy consumption (kWh/m
3
)
Q (L/h)
TMP (bar)
N (rpm)
Experimental
Predicted
1
60
2
1500
602.61
588.89
2
120
2
1500
543.55
535.73
3
60
7
1500
199.02
206.84
4
120
7
1500
182.60
196.32
5
60
4.5
750
177.81
175.35
6
120
4.5
750
149.30
140.95
7
60
4.5
2250
453.96
462.31
8
120
4.5
2250
430.58
433.04
9
90
2
750
381.31
397.49
10
90
7
750
130.36
124.99
11
90
2
2250
769.87
775.24
12
90
7
2250
342.47
326.29
13
90
4.5
1500
277.78
276.69
14
90
4.5
1500
276.39
276.69
15
90
4.5
1500
275.90
276.69
Table 4 Predicted and
experimental values of the
response at optimum conditions
Hydraulic condition
Effluent quality
Flux behavior
Energy
consumption
(kWh/m
3
)
Q (L/h)
TMP
(bar)
N (rpm)
COD
(mg/L)
Total
protein
(mg/L)
Average
flux
(L/m
2 h)
Flux
decline
75.81
7.00
2250.00
6.93
P
0.92
P
129.36
P
7.23
P
328.42
P
75.81
7.00
2250.00
6.86
E
0.89
E
131.21
E
7.34
E
329.89
E
E Experimental value; P Predicted value
Table 5 Four models of
membrane fouling proposed by
Hermia
Pore-blocking
models
n
Linear
equation
a
b
Physical concept
Schematic diagram
Complete pore
blocking (model
1)
2
ln(J) = ln(a/
t) + ln(b)
1
J 0 k b A m Formation of a
surface deposit
Internal pore
blocking (model
2)
1.5 J
−1/
2 = at + b
(2 − n)
k s ffiffiffiffiffiffi
A m
p
J 0
−1/2
Pore
blocking + surface
deposit
Intermediate pore
blocking (model
3)
1
J
−1 = at + b (2 − n)
k i J 0
J 0
−1
Pore constriction
Cake formation
(model 4)
0
J
−2 = at + b (2 − n)
k c J 0
2
J 0
−2
Pore blocking
Shear-Enhanced Filtration (SEF) for the Separation …
131