

2 Recent Applications for SEF of Protein
Solution and Case Studies
2.1 Milk Solution Filtration
SEF has been used to separate and concentrate proteins from
milk. The study, including the whole membrane industrial
process, was divided into several parts: process optimization
(Zhang et al. 2014), membrane fouling mechanism (Zhang
and Ding 2015), and membrane cleaning (Zhang et al.
2017).
Process Optimization by Response Surface Methodology
The process optimization for SEF with UF separating protein
from milk, conducted by Box–Behnken response surface
methodology (BBRSM), had three parts: effluent quality,
flux behavior, and energy consumption. The effects of
hydraulic conditions [feed flow rate (Q), mean transmembrane pressure (TMP), and rotating speed (N)] on effluent
quality, flux behavior, and energy consumption were analyzed and optimized. At first, three ultrafiltration
(UF) membranes (UH005P, UH030P, and PES050) were
used for experiments. PES050 with the largest pore size
exhibited the lowest rejection rate, whereas UH005P had the
lowest flux, because of the smallest pore size, thus UH030P,
with the moderated rejection rate and permeate flux, was the
most suitable membrane.
Then, A 1.5 h test was performed to analyze the kinetics
of permeate flux decline for BBRSM model. The results for
BBRSM design and predicted values at various hydraulic
conditions were showed in Tables 1, 2 and 3. The experimental value and predicated value are very similar, due to
the high fitting degree (R
2 ), implying BBRSM could accurately demonstrate the SEF operation. Besides, the
second-degree polynomial equations (Eqs. 1–5) were fabricated to simulate the SEF process.
For effluent quality, COD and total protein are the
response values. Equations (1) and (2) imply that high shear
stress reduced concentration polarization, then less solutes
accumulated on membrane surface or entered pores,
decreasing the diffusion of solutes through the membrane.
Accordingly, high shear effect inhibited the diffusion penetration phenomena. With respect to feed flow rate, its
increment enhanced the diffusion penetration process
through the membrane. Furthermore, the independent and
interaction effects of hydraulic conditions indicated the following order: rotating speed > TMP > feed flow rate > feed
flow rate  TMP. There were no clear interaction effects
between feed flow rate and rotating speed/TMP and rotating
speed.
With respective to flux behavior, average flux (AF) and
flux decline (FD) were chosen to evaluate it. Equations (3)
and (4) displayed that higher shear rates reduced
concentration polarization phenomena and foulants (milk
proteins) accumulation on membrane surface, then obviously eliminating the membrane fouling. Moreover, the
effect of TMP had two aspects: at low rotating speed, great
TMP enhanced concentration polarization, because of low
shear-enhanced back transport. However, the elevation of
TMP did not conduct an increment of membrane fouling at
high rotating speed, because the strong shear effect reduced
the concentration polarization. In addition, with the growth
of feed flow rate, more retained foulants (milk proteins)
accumulated and compacted fouling layer formed.
As for energy consumption (Eq. 5), the significance of
parameters on energy consumption is generally TMP > rotating speed > TMP Â rotating speed > feed flow rate.
TMP, the rotating speed and their interaction effect played a
distinct impact on energy consumption, while energy consumption emerged a linearly elevating relationship with
rotating speed and reducing clearly with TMP.
In Table 4, BBRSM was also utilized to optimize
hydraulic factors for improving effluent quality and flux
behavior, as well reducing energy consumption. The optimal
hydraulic conditions were: Q = 75.81 L/h, TMP = 7 bar,
and N = 2250 rpm. At these conditions, the highest effluent
quality, best flux behavior, and moderated energy consumption were obtained.
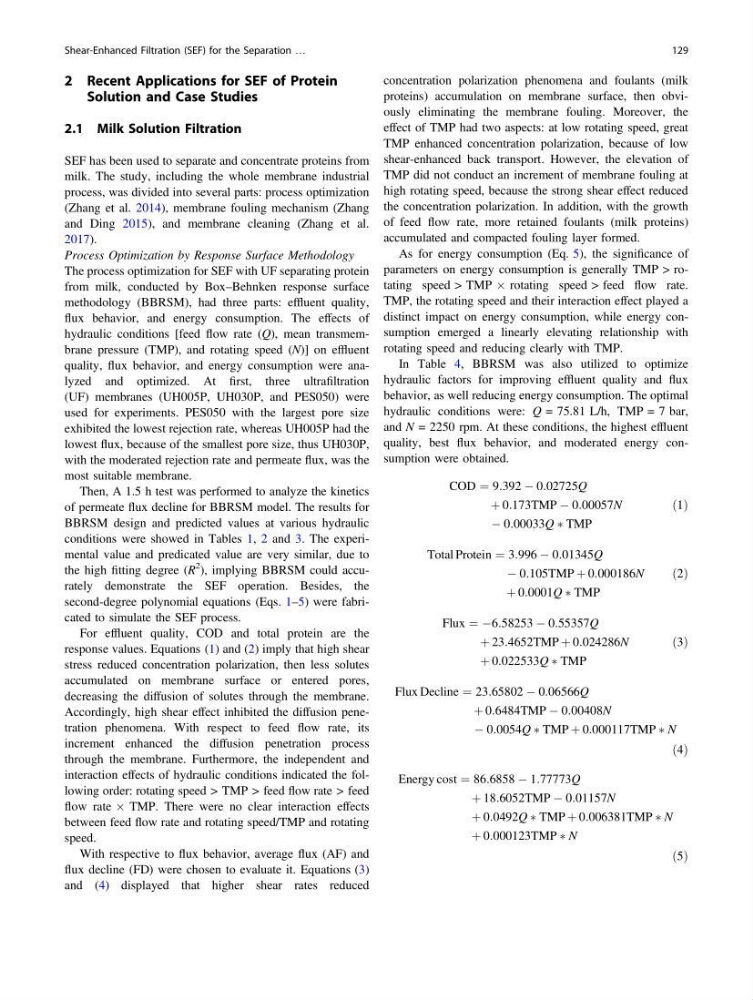
COD ¼ 9:392 À 0:02725Q
þ 0:173TMP À 0:00057N
À 0:00033Q Ã TMP
ð1Þ
Total Protein ¼ 3:996 À 0:01345Q
À 0:105TMP þ 0:000186N
þ 0:0001Q Ã TMP
ð2Þ
Flux ¼ À6:58253 À 0:55357Q
þ 23:4652TMP þ 0:024286N
þ 0:022533Q Ã TMP
ð3Þ
Flux Decline ¼ 23:65802 À 0:06566Q
þ 0:6484TMP À 0:00408N
À 0:0054Q Ã TMP þ 0:000117TMP Ã N
ð4Þ
Energy cost ¼ 86:6858 À 1:77773Q
þ 18:6052TMP À 0:01157N
þ 0:0492Q Ã TMP þ 0:006381TMP Ã N
þ 0:000123TMP Ã N
ð5Þ
Shear-Enhanced Filtration (SEF) for the Separation …
129
Solution and Case Studies
2.1 Milk Solution Filtration
SEF has been used to separate and concentrate proteins from
milk. The study, including the whole membrane industrial
process, was divided into several parts: process optimization
(Zhang et al. 2014), membrane fouling mechanism (Zhang
and Ding 2015), and membrane cleaning (Zhang et al.
2017).
Process Optimization by Response Surface Methodology
The process optimization for SEF with UF separating protein
from milk, conducted by Box–Behnken response surface
methodology (BBRSM), had three parts: effluent quality,
flux behavior, and energy consumption. The effects of
hydraulic conditions [feed flow rate (Q), mean transmembrane pressure (TMP), and rotating speed (N)] on effluent
quality, flux behavior, and energy consumption were analyzed and optimized. At first, three ultrafiltration
(UF) membranes (UH005P, UH030P, and PES050) were
used for experiments. PES050 with the largest pore size
exhibited the lowest rejection rate, whereas UH005P had the
lowest flux, because of the smallest pore size, thus UH030P,
with the moderated rejection rate and permeate flux, was the
most suitable membrane.
Then, A 1.5 h test was performed to analyze the kinetics
of permeate flux decline for BBRSM model. The results for
BBRSM design and predicted values at various hydraulic
conditions were showed in Tables 1, 2 and 3. The experimental value and predicated value are very similar, due to
the high fitting degree (R
2 ), implying BBRSM could accurately demonstrate the SEF operation. Besides, the
second-degree polynomial equations (Eqs. 1–5) were fabricated to simulate the SEF process.
For effluent quality, COD and total protein are the
response values. Equations (1) and (2) imply that high shear
stress reduced concentration polarization, then less solutes
accumulated on membrane surface or entered pores,
decreasing the diffusion of solutes through the membrane.
Accordingly, high shear effect inhibited the diffusion penetration phenomena. With respect to feed flow rate, its
increment enhanced the diffusion penetration process
through the membrane. Furthermore, the independent and
interaction effects of hydraulic conditions indicated the following order: rotating speed > TMP > feed flow rate > feed
flow rate  TMP. There were no clear interaction effects
between feed flow rate and rotating speed/TMP and rotating
speed.
With respective to flux behavior, average flux (AF) and
flux decline (FD) were chosen to evaluate it. Equations (3)
and (4) displayed that higher shear rates reduced
concentration polarization phenomena and foulants (milk
proteins) accumulation on membrane surface, then obviously eliminating the membrane fouling. Moreover, the
effect of TMP had two aspects: at low rotating speed, great
TMP enhanced concentration polarization, because of low
shear-enhanced back transport. However, the elevation of
TMP did not conduct an increment of membrane fouling at
high rotating speed, because the strong shear effect reduced
the concentration polarization. In addition, with the growth
of feed flow rate, more retained foulants (milk proteins)
accumulated and compacted fouling layer formed.
As for energy consumption (Eq. 5), the significance of
parameters on energy consumption is generally TMP > rotating speed > TMP Â rotating speed > feed flow rate.
TMP, the rotating speed and their interaction effect played a
distinct impact on energy consumption, while energy consumption emerged a linearly elevating relationship with
rotating speed and reducing clearly with TMP.
In Table 4, BBRSM was also utilized to optimize
hydraulic factors for improving effluent quality and flux
behavior, as well reducing energy consumption. The optimal
hydraulic conditions were: Q = 75.81 L/h, TMP = 7 bar,
and N = 2250 rpm. At these conditions, the highest effluent
quality, best flux behavior, and moderated energy consumption were obtained.
COD ¼ 9:392 À 0:02725Q
þ 0:173TMP À 0:00057N
À 0:00033Q Ã TMP
ð1Þ
Total Protein ¼ 3:996 À 0:01345Q
À 0:105TMP þ 0:000186N
þ 0:0001Q Ã TMP
ð2Þ
Flux ¼ À6:58253 À 0:55357Q
þ 23:4652TMP þ 0:024286N
þ 0:022533Q Ã TMP
ð3Þ
Flux Decline ¼ 23:65802 À 0:06566Q
þ 0:6484TMP À 0:00408N
À 0:0054Q Ã TMP þ 0:000117TMP Ã N
ð4Þ
Energy cost ¼ 86:6858 À 1:77773Q
þ 18:6052TMP À 0:01157N
þ 0:0492Q Ã TMP þ 0:006381TMP Ã N
þ 0:000123TMP Ã N
ð5Þ
Shear-Enhanced Filtration (SEF) for the Separation …
129