

can also be made for concentration changes produced by chemical reactions in the air. Again, the
chemical reaction schemes vary greatly in
sophistication.
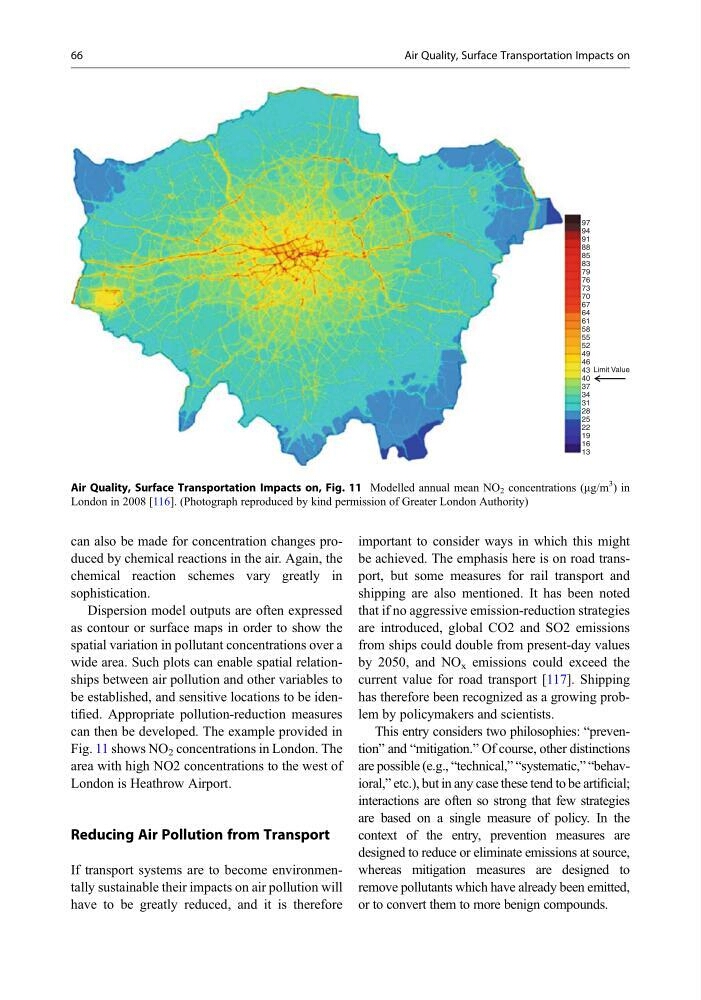
Dispersion model outputs are often expressed
as contour or surface maps in order to show the
spatial variation in pollutant concentrations over a
wide area. Such plots can enable spatial relationships between air pollution and other variables to
be established, and sensitive locations to be identified. Appropriate pollution-reduction measures
can then be developed. The example provided in
Fig. 11 shows NO 2 concentrations in London. The
area with high NO2 concentrations to the west of
London is Heathrow Airport.
Reducing Air Pollution from Transport
If transport systems are to become environmentally sustainable their impacts on air pollution will
have to be greatly reduced, and it is therefore
important to consider ways in which this might
be achieved. The emphasis here is on road transport, but some measures for rail transport and
shipping are also mentioned. It has been noted
that if no aggressive emission-reduction strategies
are introduced, global CO2 and SO2 emissions
from ships could double from present-day values
by 2050, and NO x emissions could exceed the
current value for road transport [117]. Shipping
has therefore been recognized as a growing problem by policymakers and scientists.
This entry considers two philosophies: “prevention” and “mitigation.” Of course, other distinctions
are possible (e.g., “technical,” “systematic,” “behavioral,” etc.), but in any case these tend to be artificial;
interactions are often so strong that few strategies
are based on a single measure of policy. In the
context of the entry, prevention measures are
designed to reduce or eliminate emissions at source,
whereas mitigation measures are designed to
remove pollutants which have already been emitted,
or to convert them to more benign compounds.
97
94
91
88
85
83
79
76
73
70
67
64
61
58
55
52
49
46
43 Limit Value
40
37
34
31
28
25
22
19
16
13
Air Quality, Surface Transportation Impacts on, Fig. 11 Modelled annual mean NO 2 concentrations (mg/m
3
) in
London in 2008 [116]. (Photograph reproduced by kind permission of Greater London Authority)
66
Air Quality, Surface Transportation Impacts on
chemical reaction schemes vary greatly in
sophistication.
Dispersion model outputs are often expressed
as contour or surface maps in order to show the
spatial variation in pollutant concentrations over a
wide area. Such plots can enable spatial relationships between air pollution and other variables to
be established, and sensitive locations to be identified. Appropriate pollution-reduction measures
can then be developed. The example provided in
Fig. 11 shows NO 2 concentrations in London. The
area with high NO2 concentrations to the west of
London is Heathrow Airport.
Reducing Air Pollution from Transport
If transport systems are to become environmentally sustainable their impacts on air pollution will
have to be greatly reduced, and it is therefore
important to consider ways in which this might
be achieved. The emphasis here is on road transport, but some measures for rail transport and
shipping are also mentioned. It has been noted
that if no aggressive emission-reduction strategies
are introduced, global CO2 and SO2 emissions
from ships could double from present-day values
by 2050, and NO x emissions could exceed the
current value for road transport [117]. Shipping
has therefore been recognized as a growing problem by policymakers and scientists.
This entry considers two philosophies: “prevention” and “mitigation.” Of course, other distinctions
are possible (e.g., “technical,” “systematic,” “behavioral,” etc.), but in any case these tend to be artificial;
interactions are often so strong that few strategies
are based on a single measure of policy. In the
context of the entry, prevention measures are
designed to reduce or eliminate emissions at source,
whereas mitigation measures are designed to
remove pollutants which have already been emitted,
or to convert them to more benign compounds.
97
94
91
88
85
83
79
76
73
70
67
64
61
58
55
52
49
46
43 Limit Value
40
37
34
31
28
25
22
19
16
13
Air Quality, Surface Transportation Impacts on, Fig. 11 Modelled annual mean NO 2 concentrations (mg/m
3
) in
London in 2008 [116]. (Photograph reproduced by kind permission of Greater London Authority)
66
Air Quality, Surface Transportation Impacts on