

Historical Trends
The general trend in motorized transport has been
one of unremitting growth, driven primarily by the
association of personal mobility with quality of life
[15] and its consequence in terms of passenger car
ownership. In the United States the number of cars
grew from 140,000 in 1907 to more than 20 million
in 1927 [15]. A similar pattern occurred in Europe
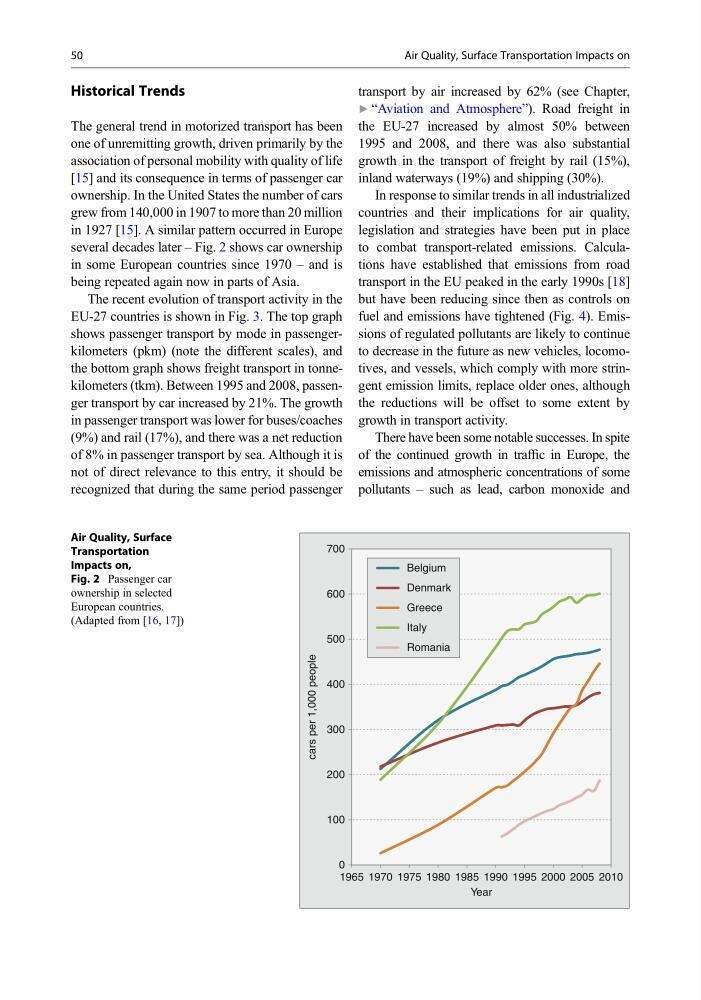
several decades later – Fig. 2 shows car ownership
in some European countries since 1970 – and is
being repeated again now in parts of Asia.
The recent evolution of transport activity in the
EU-27 countries is shown in Fig. 3. The top graph
shows passenger transport by mode in passengerkilometers (pkm) (note the different scales), and
the bottom graph shows freight transport in tonnekilometers (tkm). Between 1995 and 2008, passenger transport by car increased by 21%. The growth
in passenger transport was lower for buses/coaches
(9%) and rail (17%), and there was a net reduction
of 8% in passenger transport by sea. Although it is
not of direct relevance to this entry, it should be
recognized that during the same period passenger
transport by air increased by 62% (see Chapter,
▶ “Aviation and Atmosphere”). Road freight in
the EU-27 increased by almost 50% between
1995 and 2008, and there was also substantial
growth in the transport of freight by rail (15%),
inland waterways (19%) and shipping (30%).
In response to similar trends in all industrialized
countries and their implications for air quality,
legislation and strategies have been put in place
to combat transport-related emissions. Calculations have established that emissions from road
transport in the EU peaked in the early 1990s [18]
but have been reducing since then as controls on
fuel and emissions have tightened (Fig. 4). Emissions of regulated pollutants are likely to continue
to decrease in the future as new vehicles, locomotives, and vessels, which comply with more stringent emission limits, replace older ones, although
the reductions will be offset to some extent by
growth in transport activity.
There have been some notable successes. In spite
of the continued growth in traffic in Europe, the
emissions and atmospheric concentrations of some
pollutants – such as lead, carbon monoxide and
cars per 1,000 people
0
100
200
300
400
500
600
700
1965 1970 1975 1980 1985 1990 1995 2000 2005 2010
Year
Belgium
Denmark
Greece
Italy
Romania
Air Quality, Surface
Transportation
Impacts on,
Fig. 2 Passenger car
ownership in selected
European countries.
(Adapted from [16, 17])
50
Air Quality, Surface Transportation Impacts on
The general trend in motorized transport has been
one of unremitting growth, driven primarily by the
association of personal mobility with quality of life
[15] and its consequence in terms of passenger car
ownership. In the United States the number of cars
grew from 140,000 in 1907 to more than 20 million
in 1927 [15]. A similar pattern occurred in Europe
several decades later – Fig. 2 shows car ownership
in some European countries since 1970 – and is
being repeated again now in parts of Asia.
The recent evolution of transport activity in the
EU-27 countries is shown in Fig. 3. The top graph
shows passenger transport by mode in passengerkilometers (pkm) (note the different scales), and
the bottom graph shows freight transport in tonnekilometers (tkm). Between 1995 and 2008, passenger transport by car increased by 21%. The growth
in passenger transport was lower for buses/coaches
(9%) and rail (17%), and there was a net reduction
of 8% in passenger transport by sea. Although it is
not of direct relevance to this entry, it should be
recognized that during the same period passenger
transport by air increased by 62% (see Chapter,
▶ “Aviation and Atmosphere”). Road freight in
the EU-27 increased by almost 50% between
1995 and 2008, and there was also substantial
growth in the transport of freight by rail (15%),
inland waterways (19%) and shipping (30%).
In response to similar trends in all industrialized
countries and their implications for air quality,
legislation and strategies have been put in place
to combat transport-related emissions. Calculations have established that emissions from road
transport in the EU peaked in the early 1990s [18]
but have been reducing since then as controls on
fuel and emissions have tightened (Fig. 4). Emissions of regulated pollutants are likely to continue
to decrease in the future as new vehicles, locomotives, and vessels, which comply with more stringent emission limits, replace older ones, although
the reductions will be offset to some extent by
growth in transport activity.
There have been some notable successes. In spite
of the continued growth in traffic in Europe, the
emissions and atmospheric concentrations of some
pollutants – such as lead, carbon monoxide and
cars per 1,000 people
0
100
200
300
400
500
600
700
1965 1970 1975 1980 1985 1990 1995 2000 2005 2010
Year
Belgium
Denmark
Greece
Italy
Romania
Air Quality, Surface
Transportation
Impacts on,
Fig. 2 Passenger car
ownership in selected
European countries.
(Adapted from [16, 17])
50
Air Quality, Surface Transportation Impacts on