

ambient concentration for PM that is being evaluated for an association, not PM exposure. The
PM exposure cannot be evaluated since the estimated indoor PM concentrations cannot even be
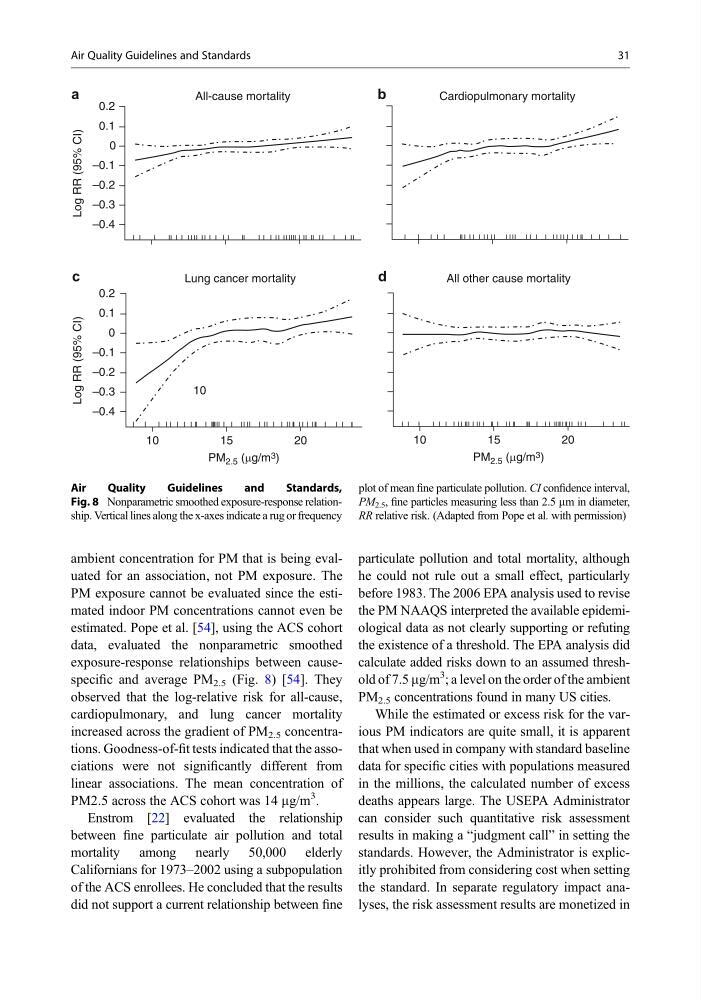
estimated. Pope et al. [54], using the ACS cohort
data, evaluated the nonparametric smoothed
exposure-response relationships between causespecific and average PM 2.5 (Fig. 8) [54]. They
observed that the log-relative risk for all-cause,
cardiopulmonary, and lung cancer mortality
increased across the gradient of PM 2.5 concentrations. Goodness-of-fit tests indicated that the associations were not significantly different from
linear associations. The mean concentration of
PM2.5 across the ACS cohort was 14 mg/m
3 .
Enstrom [22] evaluated the relationship
between fine particulate air pollution and total
mortality among nearly 50,000 elderly
Californians for 1973–2002 using a subpopulation
of the ACS enrollees. He concluded that the results
did not support a current relationship between fine
particulate pollution and total mortality, although
he could not rule out a small effect, particularly
before 1983. The 2006 EPA analysis used to revise
the PM NAAQS interpreted the available epidemiological data as not clearly supporting or refuting
the existence of a threshold. The EPA analysis did
calculate added risks down to an assumed threshold of 7.5 mg/m
3
; a level on the order of the ambient
PM 2.5 concentrations found in many US cities.
While the estimated or excess risk for the various PM indicators are quite small, it is apparent
that when used in company with standard baseline
data for specific cities with populations measured
in the millions, the calculated number of excess
deaths appears large. The USEPA Administrator
can consider such quantitative risk assessment
results in making a “judgment call” in setting the
standards. However, the Administrator is explicitly prohibited from considering cost when setting
the standard. In separate regulatory impact analyses, the risk assessment results are monetized in
Lung cancer mortality
PM 2.5 (µg/m 3 )
0.2
0.1
0
–0.1
–0.2
–0.3
–0.4
10
c
15
20
10
Log RR (95% CI)
Cardiopulmonary mortality
b
All-cause mortality
0.2
0.1
0
–0.1
–0.2
–0.3
–0.4
a
Log RR (95% CI)
All other cause mortality
PM 2.5 (µg/m 3 )
d
10
15
20
Air
Quality
Guidelines
and
Standards,
Fig. 8 Nonparametric smoothed exposure-response relationship. Vertical lines along the x-axes indicate a rug or frequency
plot of mean fine particulate pollution. CI confidence interval,
PM 2.5 , fine particles measuring less than 2.5 mm in diameter,
RR relative risk. (Adapted from Pope et al. with permission)
Air Quality Guidelines and Standards
31
PM exposure cannot be evaluated since the estimated indoor PM concentrations cannot even be
estimated. Pope et al. [54], using the ACS cohort
data, evaluated the nonparametric smoothed
exposure-response relationships between causespecific and average PM 2.5 (Fig. 8) [54]. They
observed that the log-relative risk for all-cause,
cardiopulmonary, and lung cancer mortality
increased across the gradient of PM 2.5 concentrations. Goodness-of-fit tests indicated that the associations were not significantly different from
linear associations. The mean concentration of
PM2.5 across the ACS cohort was 14 mg/m
3 .
Enstrom [22] evaluated the relationship
between fine particulate air pollution and total
mortality among nearly 50,000 elderly
Californians for 1973–2002 using a subpopulation
of the ACS enrollees. He concluded that the results
did not support a current relationship between fine
particulate pollution and total mortality, although
he could not rule out a small effect, particularly
before 1983. The 2006 EPA analysis used to revise
the PM NAAQS interpreted the available epidemiological data as not clearly supporting or refuting
the existence of a threshold. The EPA analysis did
calculate added risks down to an assumed threshold of 7.5 mg/m
3
; a level on the order of the ambient
PM 2.5 concentrations found in many US cities.
While the estimated or excess risk for the various PM indicators are quite small, it is apparent
that when used in company with standard baseline
data for specific cities with populations measured
in the millions, the calculated number of excess
deaths appears large. The USEPA Administrator
can consider such quantitative risk assessment
results in making a “judgment call” in setting the
standards. However, the Administrator is explicitly prohibited from considering cost when setting
the standard. In separate regulatory impact analyses, the risk assessment results are monetized in
Lung cancer mortality
PM 2.5 (µg/m 3 )
0.2
0.1
0
–0.1
–0.2
–0.3
–0.4
10
c
15
20
10
Log RR (95% CI)
Cardiopulmonary mortality
b
All-cause mortality
0.2
0.1
0
–0.1
–0.2
–0.3
–0.4
a
Log RR (95% CI)
All other cause mortality
PM 2.5 (µg/m 3 )
d
10
15
20
Air
Quality
Guidelines
and
Standards,
Fig. 8 Nonparametric smoothed exposure-response relationship. Vertical lines along the x-axes indicate a rug or frequency
plot of mean fine particulate pollution. CI confidence interval,
PM 2.5 , fine particles measuring less than 2.5 mm in diameter,
RR relative risk. (Adapted from Pope et al. with permission)
Air Quality Guidelines and Standards
31