

day per customer). Network sensitivities are
caused by heat expansion causing wires to sag,
transformer overheating, and an increased tendency of fuses to blow [55]. Heatwaves can result
in peak demands [49], as observed by South
Australia and Victoria in 2009 when temperatures
drove electricity demand to reach record
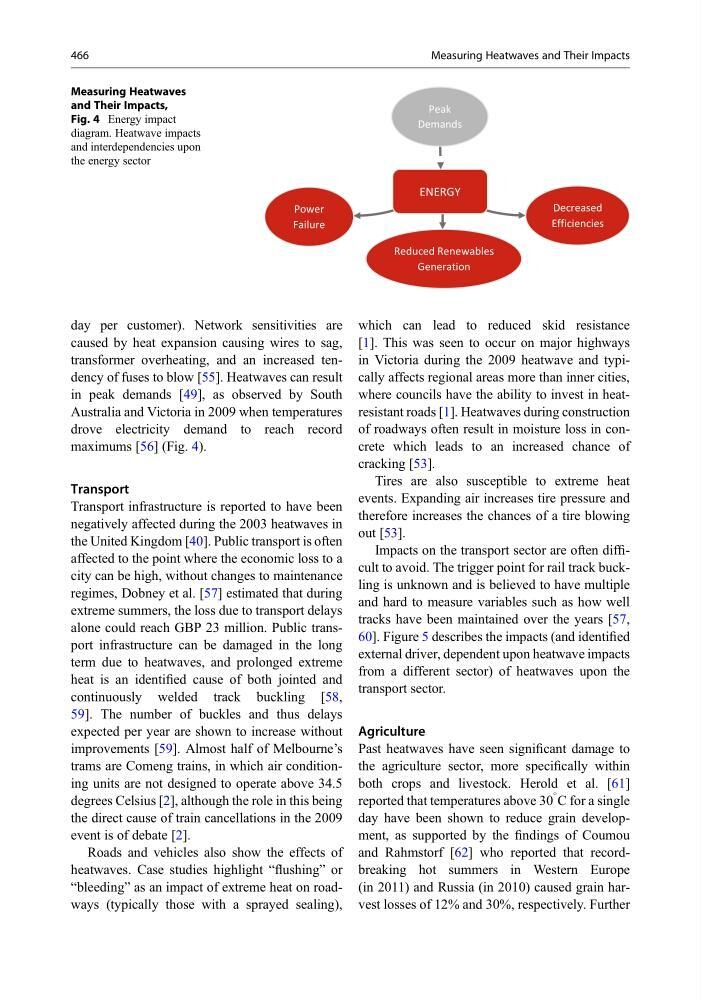
maximums [56] (Fig. 4).
Transport
Transport infrastructure is reported to have been
negatively affected during the 2003 heatwaves in
the United Kingdom [40]. Public transport is often
affected to the point where the economic loss to a
city can be high, without changes to maintenance
regimes, Dobney et al. [57] estimated that during
extreme summers, the loss due to transport delays
alone could reach GBP 23 million. Public transport infrastructure can be damaged in the long
term due to heatwaves, and prolonged extreme
heat is an identified cause of both jointed and
continuously welded track buckling [58,
59]. The number of buckles and thus delays
expected per year are shown to increase without
improvements [59]. Almost half of Melbourne’s
trams are Comeng trains, in which air conditioning units are not designed to operate above 34.5
degrees Celsius [2], although the role in this being
the direct cause of train cancellations in the 2009
event is of debate [2].
Roads and vehicles also show the effects of
heatwaves. Case studies highlight “flushing” or
“bleeding” as an impact of extreme heat on roadways (typically those with a sprayed sealing),
which can lead to reduced skid resistance
[1]. This was seen to occur on major highways
in Victoria during the 2009 heatwave and typically affects regional areas more than inner cities,
where councils have the ability to invest in heatresistant roads [1]. Heatwaves during construction
of roadways often result in moisture loss in concrete which leads to an increased chance of
cracking [53].
Tires are also susceptible to extreme heat
events. Expanding air increases tire pressure and
therefore increases the chances of a tire blowing
out [53].
Impacts on the transport sector are often difficult to avoid. The trigger point for rail track buckling is unknown and is believed to have multiple
and hard to measure variables such as how well
tracks have been maintained over the years [57,
60]. Figure 5 describes the impacts (and identified
external driver, dependent upon heatwave impacts
from a different sector) of heatwaves upon the
transport sector.
Agriculture
Past heatwaves have seen significant damage to
the agriculture sector, more specifically within
both crops and livestock. Herold et al. [61]
reported that temperatures above 30
C for a single
day have been shown to reduce grain development, as supported by the findings of Coumou
and Rahmstorf [62] who reported that recordbreaking hot summers in Western Europe
(in 2011) and Russia (in 2010) caused grain harvest losses of 12% and 30%, respectively. Further
ENERGY
Power
Failure
Decreased
Efficiencies
Reduced Renewables
Generation
Peak
Demands
Measuring Heatwaves
and Their Impacts,
Fig. 4 Energy impact
diagram. Heatwave impacts
and interdependencies upon
the energy sector
466
Measuring Heatwaves and Their Impacts
caused by heat expansion causing wires to sag,
transformer overheating, and an increased tendency of fuses to blow [55]. Heatwaves can result
in peak demands [49], as observed by South
Australia and Victoria in 2009 when temperatures
drove electricity demand to reach record
maximums [56] (Fig. 4).
Transport
Transport infrastructure is reported to have been
negatively affected during the 2003 heatwaves in
the United Kingdom [40]. Public transport is often
affected to the point where the economic loss to a
city can be high, without changes to maintenance
regimes, Dobney et al. [57] estimated that during
extreme summers, the loss due to transport delays
alone could reach GBP 23 million. Public transport infrastructure can be damaged in the long
term due to heatwaves, and prolonged extreme
heat is an identified cause of both jointed and
continuously welded track buckling [58,
59]. The number of buckles and thus delays
expected per year are shown to increase without
improvements [59]. Almost half of Melbourne’s
trams are Comeng trains, in which air conditioning units are not designed to operate above 34.5
degrees Celsius [2], although the role in this being
the direct cause of train cancellations in the 2009
event is of debate [2].
Roads and vehicles also show the effects of
heatwaves. Case studies highlight “flushing” or
“bleeding” as an impact of extreme heat on roadways (typically those with a sprayed sealing),
which can lead to reduced skid resistance
[1]. This was seen to occur on major highways
in Victoria during the 2009 heatwave and typically affects regional areas more than inner cities,
where councils have the ability to invest in heatresistant roads [1]. Heatwaves during construction
of roadways often result in moisture loss in concrete which leads to an increased chance of
cracking [53].
Tires are also susceptible to extreme heat
events. Expanding air increases tire pressure and
therefore increases the chances of a tire blowing
out [53].
Impacts on the transport sector are often difficult to avoid. The trigger point for rail track buckling is unknown and is believed to have multiple
and hard to measure variables such as how well
tracks have been maintained over the years [57,
60]. Figure 5 describes the impacts (and identified
external driver, dependent upon heatwave impacts
from a different sector) of heatwaves upon the
transport sector.
Agriculture
Past heatwaves have seen significant damage to
the agriculture sector, more specifically within
both crops and livestock. Herold et al. [61]
reported that temperatures above 30
C for a single
day have been shown to reduce grain development, as supported by the findings of Coumou
and Rahmstorf [62] who reported that recordbreaking hot summers in Western Europe
(in 2011) and Russia (in 2010) caused grain harvest losses of 12% and 30%, respectively. Further
ENERGY
Power
Failure
Decreased
Efficiencies
Reduced Renewables
Generation
Peak
Demands
Measuring Heatwaves
and Their Impacts,
Fig. 4 Energy impact
diagram. Heatwave impacts
and interdependencies upon
the energy sector
466
Measuring Heatwaves and Their Impacts