

PM 2.5 levels were lower in the extended follow-up
period in the 1990s than in 1974–1989 and the
mortality risk ratios were lower.
A critical issue in interpreting the data shown
in Fig. 8 is the nature of the exposure-response
relationship. It must be noted that this is the
1.50
RR (95% CL)
1.40
1.30
1.20
1.10
1.00
0.96
0.80
1.50
RR (95% CL)
1.40
1.30
1.20
1.10
1.00
0.96
0.80
1.50
b
RR (95% CL)
1.40
1.30
1.20
1.10
1.00
0.96
0.80
1.50
RR (95% CL)
1.40
1.30
1.20
1.10
1.00
0.96
0.80
a
c
d
Lung cancer mortality
Cardiopulmonary mortality
All-cause mortality
All other cause mortality
1 9 7 9 – 1 9 8 3
1 9 9 9 – 2 0 0 0
A v e r a g e
Fine particles
(PM 2.5 )
Inhalable, coarse particles
Total suspended
particles
Sulphate
particles
Sulphur
dioxide
Nitrogen
dioxide
Carbon
monoxide
Ozone
Gaseous pollutants
1 9 8 7 – 1 9 9 6
( P M 1 0
)
1 9 7 9 – 1 9 8 3
( P M 1 5
)
1 9 7 9 – 1 9 8 3
( P M 1 5 ,2 .5
)
1 9 8 0 – 1 9 8 1
1 9 7 9 – 1 9 8 3
1 9 8 2 – 1 9 8 6
1 9 8 0 – 1 9 8 1
1 9 9 0
1 9 8 0
1 9 8 2 – 1 9 9 8
1 9 8 0
1 9 8 0
1 9 8 2 – 1 9 9 8
1 9 8 2 – 1 9 9 8
1 9 8 2 – 1 9 9 8
1 9 8 2 – 1 9 9 8
t h ir d
q u a r t e r
1 9 8 0 – 1 9 8 1
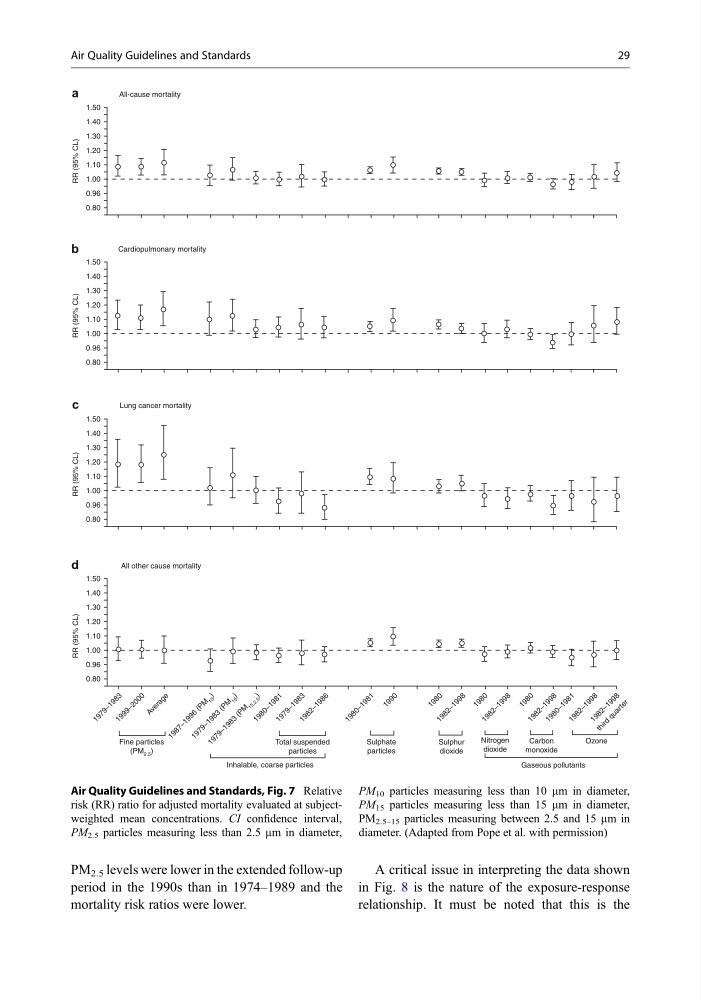
Air Quality Guidelines and Standards, Fig. 7 Relative
risk (RR) ratio for adjusted mortality evaluated at subjectweighted mean concentrations. CI confidence interval,
PM 2.5 particles measuring less than 2.5 mm in diameter,
PM 10 particles measuring less than 10 mm in diameter,
PM 15 particles measuring less than 15 mm in diameter,
PM 2.5–15 particles measuring between 2.5 and 15 mm in
diameter. (Adapted from Pope et al. with permission)
Air Quality Guidelines and Standards
29
period in the 1990s than in 1974–1989 and the
mortality risk ratios were lower.
A critical issue in interpreting the data shown
in Fig. 8 is the nature of the exposure-response
relationship. It must be noted that this is the
1.50
RR (95% CL)
1.40
1.30
1.20
1.10
1.00
0.96
0.80
1.50
RR (95% CL)
1.40
1.30
1.20
1.10
1.00
0.96
0.80
1.50
b
RR (95% CL)
1.40
1.30
1.20
1.10
1.00
0.96
0.80
1.50
RR (95% CL)
1.40
1.30
1.20
1.10
1.00
0.96
0.80
a
c
d
Lung cancer mortality
Cardiopulmonary mortality
All-cause mortality
All other cause mortality
1 9 7 9 – 1 9 8 3
1 9 9 9 – 2 0 0 0
A v e r a g e
Fine particles
(PM 2.5 )
Inhalable, coarse particles
Total suspended
particles
Sulphate
particles
Sulphur
dioxide
Nitrogen
dioxide
Carbon
monoxide
Ozone
Gaseous pollutants
1 9 8 7 – 1 9 9 6
( P M 1 0
)
1 9 7 9 – 1 9 8 3
( P M 1 5
)
1 9 7 9 – 1 9 8 3
( P M 1 5 ,2 .5
)
1 9 8 0 – 1 9 8 1
1 9 7 9 – 1 9 8 3
1 9 8 2 – 1 9 8 6
1 9 8 0 – 1 9 8 1
1 9 9 0
1 9 8 0
1 9 8 2 – 1 9 9 8
1 9 8 0
1 9 8 0
1 9 8 2 – 1 9 9 8
1 9 8 2 – 1 9 9 8
1 9 8 2 – 1 9 9 8
1 9 8 2 – 1 9 9 8
t h ir d
q u a r t e r
1 9 8 0 – 1 9 8 1
Air Quality Guidelines and Standards, Fig. 7 Relative
risk (RR) ratio for adjusted mortality evaluated at subjectweighted mean concentrations. CI confidence interval,
PM 2.5 particles measuring less than 2.5 mm in diameter,
PM 10 particles measuring less than 10 mm in diameter,
PM 15 particles measuring less than 15 mm in diameter,
PM 2.5–15 particles measuring between 2.5 and 15 mm in
diameter. (Adapted from Pope et al. with permission)
Air Quality Guidelines and Standards
29