

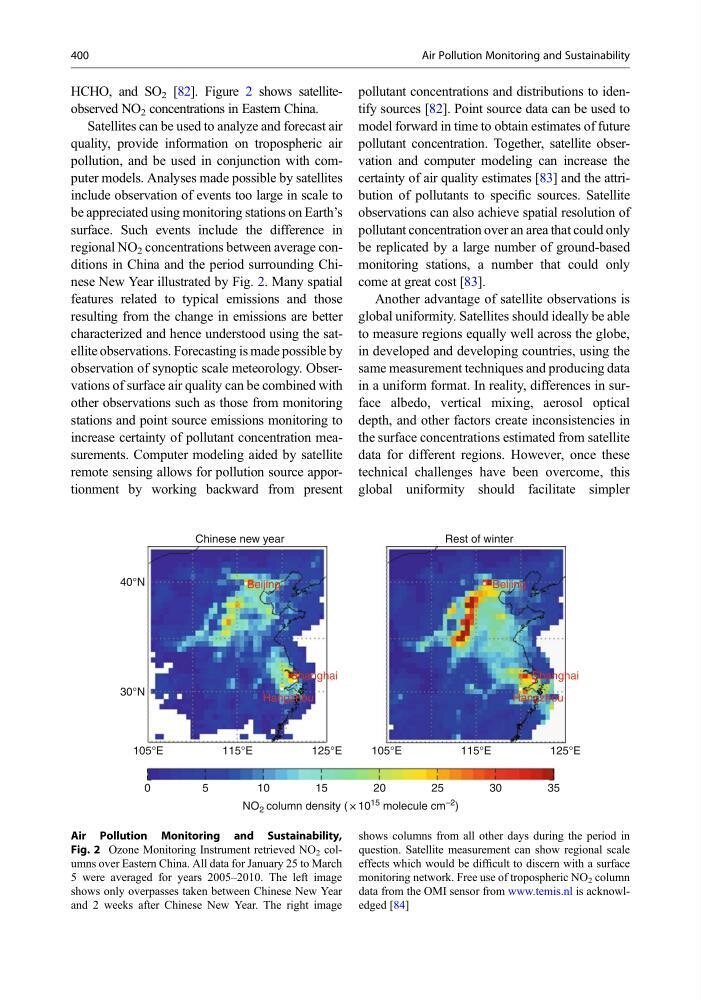
HCHO, and SO 2 [82]. Figure 2 shows satelliteobserved NO 2 concentrations in Eastern China.
Satellites can be used to analyze and forecast air
quality, provide information on tropospheric air
pollution, and be used in conjunction with computer models. Analyses made possible by satellites
include observation of events too large in scale to
be appreciated using monitoring stations on Earth’s
surface. Such events include the difference in
regional NO 2 concentrations between average conditions in China and the period surrounding Chinese New Year illustrated by Fig. 2. Many spatial
features related to typical emissions and those
resulting from the change in emissions are better
characterized and hence understood using the satellite observations. Forecasting is made possible by
observation of synoptic scale meteorology. Observations of surface air quality can be combined with
other observations such as those from monitoring
stations and point source emissions monitoring to
increase certainty of pollutant concentration measurements. Computer modeling aided by satellite
remote sensing allows for pollution source apportionment by working backward from present
pollutant concentrations and distributions to identify sources [82]. Point source data can be used to
model forward in time to obtain estimates of future
pollutant concentration. Together, satellite observation and computer modeling can increase the
certainty of air quality estimates [83] and the attribution of pollutants to specific sources. Satellite
observations can also achieve spatial resolution of
pollutant concentration over an area that could only
be replicated by a large number of ground-based
monitoring stations, a number that could only
come at great cost [83].
Another advantage of satellite observations is
global uniformity. Satellites should ideally be able
to measure regions equally well across the globe,
in developed and developing countries, using the
same measurement techniques and producing data
in a uniform format. In reality, differences in surface albedo, vertical mixing, aerosol optical
depth, and other factors create inconsistencies in
the surface concentrations estimated from satellite
data for different regions. However, once these
technical challenges have been overcome, this
global uniformity should facilitate simpler
0
5
10
15
20
25
30
35
NO 2 column density ( × 10 15 molecule cm –2 )
r
e
t
n
i
w
f
o
t
s
e
R
r
a
e
y
w
e
n
e
s
e
n
i
h
C
E
°
5
0
1
E
°
5
0
1
E
°
5
1
1
E
°
5
1
1
E
°
5
2
1
E
°
5
2
1
g
n
i
j
i
e
B
g
n
i
j
i
e
B
i
a
h
g
n
a
h
S
i
a
h
g
n
a
h
S
u
o
h
z
g
n
a
H
u
o
h
z
g
n
a
H
30°N
40°N
Air Pollution Monitoring and Sustainability,
Fig. 2 Ozone Monitoring Instrument retrieved NO 2 columns over Eastern China. All data for January 25 to March
5 were averaged for years 2005–2010. The left image
shows only overpasses taken between Chinese New Year
and 2 weeks after Chinese New Year. The right image
shows columns from all other days during the period in
question. Satellite measurement can show regional scale
effects which would be difficult to discern with a surface
monitoring network. Free use of tropospheric NO 2 column
data from the OMI sensor from www.temis.nl is acknowledged [84]
400
Air Pollution Monitoring and Sustainability
Satellites can be used to analyze and forecast air
quality, provide information on tropospheric air
pollution, and be used in conjunction with computer models. Analyses made possible by satellites
include observation of events too large in scale to
be appreciated using monitoring stations on Earth’s
surface. Such events include the difference in
regional NO 2 concentrations between average conditions in China and the period surrounding Chinese New Year illustrated by Fig. 2. Many spatial
features related to typical emissions and those
resulting from the change in emissions are better
characterized and hence understood using the satellite observations. Forecasting is made possible by
observation of synoptic scale meteorology. Observations of surface air quality can be combined with
other observations such as those from monitoring
stations and point source emissions monitoring to
increase certainty of pollutant concentration measurements. Computer modeling aided by satellite
remote sensing allows for pollution source apportionment by working backward from present
pollutant concentrations and distributions to identify sources [82]. Point source data can be used to
model forward in time to obtain estimates of future
pollutant concentration. Together, satellite observation and computer modeling can increase the
certainty of air quality estimates [83] and the attribution of pollutants to specific sources. Satellite
observations can also achieve spatial resolution of
pollutant concentration over an area that could only
be replicated by a large number of ground-based
monitoring stations, a number that could only
come at great cost [83].
Another advantage of satellite observations is
global uniformity. Satellites should ideally be able
to measure regions equally well across the globe,
in developed and developing countries, using the
same measurement techniques and producing data
in a uniform format. In reality, differences in surface albedo, vertical mixing, aerosol optical
depth, and other factors create inconsistencies in
the surface concentrations estimated from satellite
data for different regions. However, once these
technical challenges have been overcome, this
global uniformity should facilitate simpler
0
5
10
15
20
25
30
35
NO 2 column density ( × 10 15 molecule cm –2 )
r
e
t
n
i
w
f
o
t
s
e
R
r
a
e
y
w
e
n
e
s
e
n
i
h
C
E
°
5
0
1
E
°
5
0
1
E
°
5
1
1
E
°
5
1
1
E
°
5
2
1
E
°
5
2
1
g
n
i
j
i
e
B
g
n
i
j
i
e
B
i
a
h
g
n
a
h
S
i
a
h
g
n
a
h
S
u
o
h
z
g
n
a
H
u
o
h
z
g
n
a
H
30°N
40°N
Air Pollution Monitoring and Sustainability,
Fig. 2 Ozone Monitoring Instrument retrieved NO 2 columns over Eastern China. All data for January 25 to March
5 were averaged for years 2005–2010. The left image
shows only overpasses taken between Chinese New Year
and 2 weeks after Chinese New Year. The right image
shows columns from all other days during the period in
question. Satellite measurement can show regional scale
effects which would be difficult to discern with a surface
monitoring network. Free use of tropospheric NO 2 column
data from the OMI sensor from www.temis.nl is acknowledged [84]
400
Air Pollution Monitoring and Sustainability