

atmospheric processes undergone by aerosols
after emission or formation in the atmosphere are
detailed in Fig. 10 [44, 48].
Concentrations of reported PM range from less
than 1 mg m
À3 (PM 10 ) in a remote location such as
the Antarctic to 340 mg m
À3 (PM 10 ) and
194 mg m
À3 (PM 2.5 ) annual average concentrations for Lahore, Pakistan in 2007, which is
extremely polluted and has some of the highest
PM concentrations recorded [49–51]. The WHO
annual average guideline for PM 10 is 20 mg m
À3
and 10 mg m
À3 for PM 2.5 . Annual average concentrations in 2001 of PM 2.5 and PM 10 from three
European cities ranged from 7.8 to 28.0 mg m
À3 to
15.7–41.0 mg m
À3 , respectively [52].
Various types of modeling have been
established that are able to determine the
contributions of different types of aerosol sources
to ambient particulate matter samples, including
factor analysis and chemical mass balance (CMB)
modeling. More information about these types of
models can be found in section “Modeling”.
Air Quality Measurements
Networks of air pollution monitoring stations
have been set up across many areas of the globe,
especially in developed countries. In the USA, for
example, ambient air quality monitoring programs are required of states by the US EPA to
assess and determine compliance with the
national ambient air quality standards. The air
quality monitors and monitoring programs must
Rainout
&
washout
Sedimentation
Particle diameter, μm
Coagulation
100
10
1
0.1
0.01
Transient nuclei or
aitken nuclei range
Accumulation
range
Mechanically generated
aerosol range
Coarse particles
Fine particles
0.001
Droplets
Condensation
growth of nuclei
Wind blown dust
+
Emissions
+
Sea spray
+
Volcanoes
+
Plant particles
Homogeneous
nucleation
Low
volatility
vapor
Chemical conversion
of gases to low
volatility vapors
Hot vapor
Condensation
Primary
particles
Coagulation
Chain
aggregates
C o ag ulatio n
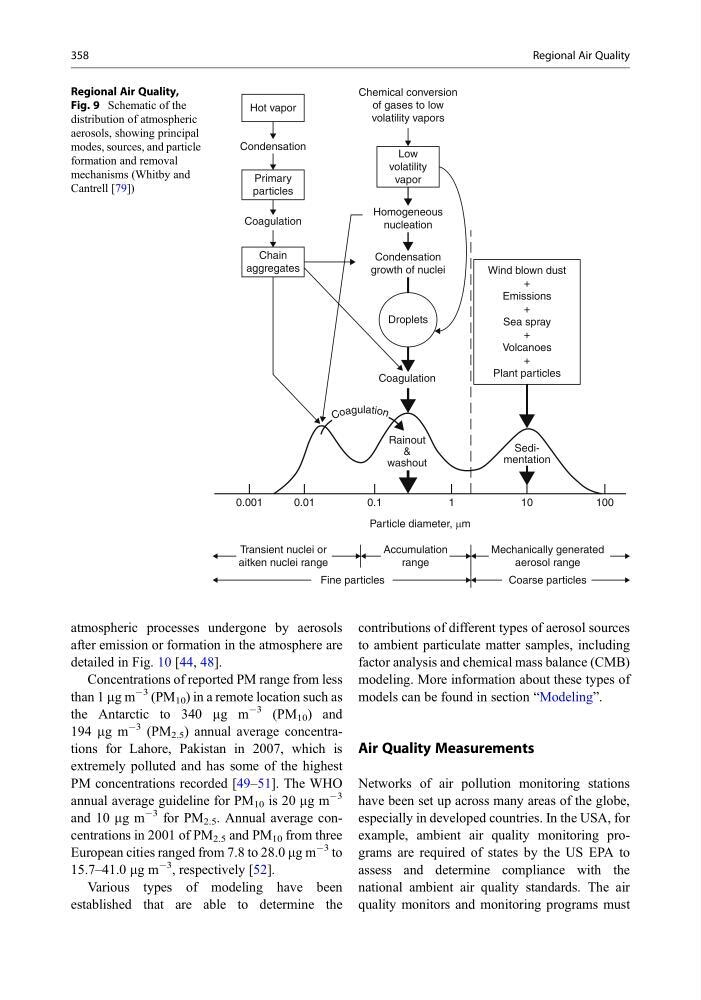
Regional Air Quality,
Fig. 9 Schematic of the
distribution of atmospheric
aerosols, showing principal
modes, sources, and particle
formation and removal
mechanisms (Whitby and
Cantrell [79])
358
Regional Air Quality
after emission or formation in the atmosphere are
detailed in Fig. 10 [44, 48].
Concentrations of reported PM range from less
than 1 mg m
À3 (PM 10 ) in a remote location such as
the Antarctic to 340 mg m
À3 (PM 10 ) and
194 mg m
À3 (PM 2.5 ) annual average concentrations for Lahore, Pakistan in 2007, which is
extremely polluted and has some of the highest
PM concentrations recorded [49–51]. The WHO
annual average guideline for PM 10 is 20 mg m
À3
and 10 mg m
À3 for PM 2.5 . Annual average concentrations in 2001 of PM 2.5 and PM 10 from three
European cities ranged from 7.8 to 28.0 mg m
À3 to
15.7–41.0 mg m
À3 , respectively [52].
Various types of modeling have been
established that are able to determine the
contributions of different types of aerosol sources
to ambient particulate matter samples, including
factor analysis and chemical mass balance (CMB)
modeling. More information about these types of
models can be found in section “Modeling”.
Air Quality Measurements
Networks of air pollution monitoring stations
have been set up across many areas of the globe,
especially in developed countries. In the USA, for
example, ambient air quality monitoring programs are required of states by the US EPA to
assess and determine compliance with the
national ambient air quality standards. The air
quality monitors and monitoring programs must
Rainout
&
washout
Sedimentation
Particle diameter, μm
Coagulation
100
10
1
0.1
0.01
Transient nuclei or
aitken nuclei range
Accumulation
range
Mechanically generated
aerosol range
Coarse particles
Fine particles
0.001
Droplets
Condensation
growth of nuclei
Wind blown dust
+
Emissions
+
Sea spray
+
Volcanoes
+
Plant particles
Homogeneous
nucleation
Low
volatility
vapor
Chemical conversion
of gases to low
volatility vapors
Hot vapor
Condensation
Primary
particles
Coagulation
Chain
aggregates
C o ag ulatio n
Regional Air Quality,
Fig. 9 Schematic of the
distribution of atmospheric
aerosols, showing principal
modes, sources, and particle
formation and removal
mechanisms (Whitby and
Cantrell [79])
358
Regional Air Quality