

predominantly by heterogeneous nucleation have a
small number concentration of ice crystals. IN injection into a clean environment leads to heterogeneous
ice crystal formation before homogeneous freezing
can occur. Thus the ice cloud changed by air traffic
has less but bigger crystals than a cloud that would
have formed purely homogeneously. If heterogeneous ice formation is dominant as in a polluted air
mass, the addition of IN can lead to more but smaller
ice crystals. This simplified picture has to be modified: First, whether heterogeneous or homogeneous
freezing dominates depends not only on the relative
number of the respective aerosol particle types but
also on vertical wind speed (determining adiabatic
cooling rates). Second, IN from various sources may
have a spectrum of threshold supersaturations over
an ice surface. These thresholds depend on temperature and on particle coating. Third, ice formation in
supersaturated air with respect to an ice surface is
difficult to be represented in large-scale models,
because a supersaturated state is not uniquely related
with a cloudiness state. Hence first model simulations like those by Penner et al. [29] have therefore
rather the value of highlighting the problems than
yielding firm results.
But also natural cirrus clouds can be affected
by contrails formed within them or in their
vicinity, in particular when these contrails spread
and eventually form the so-called contrail cirrus,
because these two ice cloud types compete for the
same space and for the same supersaturated water
vapor.
Aviation-Induced Cloudiness (AIC) has been
defined as the sum of all changes in cloudiness
associated with aviation operations [20]; hence, it
combines jet exhaust condensation trails, often
abbreviated as contrails, and so-called persistent
contrail cover. The assessment of the latter is very
difficult, because AIC may be indistinguishable
from background cirrus cover. This was the reason for IPCC [20] not to give a best estimate of
AIC amounts and its associated radiative forcing.
The value given in IPCC [20] for emissions until
2005 and a time horizon of 100 years, namely
0.03 W/m, is above the radiative forcing of
0.025 W/m for CO 2 alone. Thus more than a
factor of 2 would be needed, if the total air traffic
influence on radiative forcing has to be accounted
for, knowing only the fuel burned and excluding
additions related to air chemistry. Have these
values given by IPCC in 2007 changed during
recent research? Yes, but earlier relations between
the impacts by greenhouse gases and cloudiness
changes (caused by contrails and contrail cirrus)
−4
4
0
−4
4
0
−4
4
0
1984
1988
1992
1996
2000
2004
2008
HIGH air traffic corridors
N. America, Europe, N. Atlantic, N. Pacific
LOW air traffic corridors
Anomalies (%)
Anomalies (%)
(+0.9)
(+0.6)
(−0.3)
Differences (%)
Aviation and
Atmosphere,
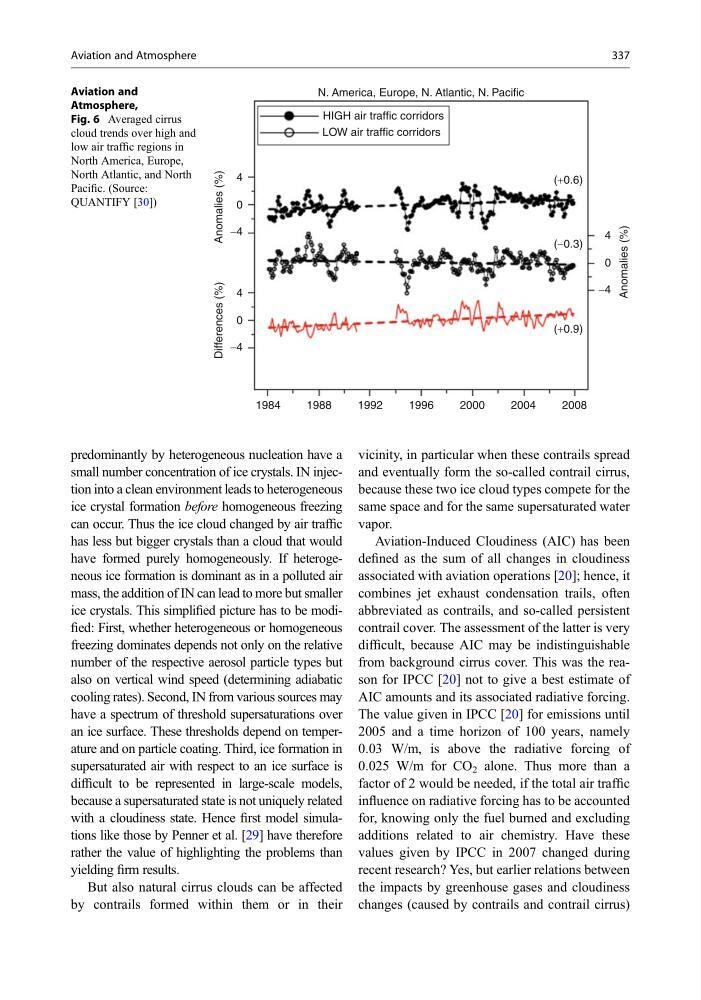
Fig. 6 Averaged cirrus
cloud trends over high and
low air traffic regions in
North America, Europe,
North Atlantic, and North
Pacific. (Source:
QUANTIFY [30])
Aviation and Atmosphere
337
small number concentration of ice crystals. IN injection into a clean environment leads to heterogeneous
ice crystal formation before homogeneous freezing
can occur. Thus the ice cloud changed by air traffic
has less but bigger crystals than a cloud that would
have formed purely homogeneously. If heterogeneous ice formation is dominant as in a polluted air
mass, the addition of IN can lead to more but smaller
ice crystals. This simplified picture has to be modified: First, whether heterogeneous or homogeneous
freezing dominates depends not only on the relative
number of the respective aerosol particle types but
also on vertical wind speed (determining adiabatic
cooling rates). Second, IN from various sources may
have a spectrum of threshold supersaturations over
an ice surface. These thresholds depend on temperature and on particle coating. Third, ice formation in
supersaturated air with respect to an ice surface is
difficult to be represented in large-scale models,
because a supersaturated state is not uniquely related
with a cloudiness state. Hence first model simulations like those by Penner et al. [29] have therefore
rather the value of highlighting the problems than
yielding firm results.
But also natural cirrus clouds can be affected
by contrails formed within them or in their
vicinity, in particular when these contrails spread
and eventually form the so-called contrail cirrus,
because these two ice cloud types compete for the
same space and for the same supersaturated water
vapor.
Aviation-Induced Cloudiness (AIC) has been
defined as the sum of all changes in cloudiness
associated with aviation operations [20]; hence, it
combines jet exhaust condensation trails, often
abbreviated as contrails, and so-called persistent
contrail cover. The assessment of the latter is very
difficult, because AIC may be indistinguishable
from background cirrus cover. This was the reason for IPCC [20] not to give a best estimate of
AIC amounts and its associated radiative forcing.
The value given in IPCC [20] for emissions until
2005 and a time horizon of 100 years, namely
0.03 W/m, is above the radiative forcing of
0.025 W/m for CO 2 alone. Thus more than a
factor of 2 would be needed, if the total air traffic
influence on radiative forcing has to be accounted
for, knowing only the fuel burned and excluding
additions related to air chemistry. Have these
values given by IPCC in 2007 changed during
recent research? Yes, but earlier relations between
the impacts by greenhouse gases and cloudiness
changes (caused by contrails and contrail cirrus)
−4
4
0
−4
4
0
−4
4
0
1984
1988
1992
1996
2000
2004
2008
HIGH air traffic corridors
N. America, Europe, N. Atlantic, N. Pacific
LOW air traffic corridors
Anomalies (%)
Anomalies (%)
(+0.9)
(+0.6)
(−0.3)
Differences (%)
Aviation and
Atmosphere,
Fig. 6 Averaged cirrus
cloud trends over high and
low air traffic regions in
North America, Europe,
North Atlantic, and North
Pacific. (Source:
QUANTIFY [30])
Aviation and Atmosphere
337